A Practical Guide to Benchmarking Computational Biology Tools: From Foundational Principles to Clinical Impact
This article provides a comprehensive guide for researchers and drug development professionals on the rigorous benchmarking of computational biology tools.
A Practical Guide to Benchmarking Computational Biology Tools: From Foundational Principles to Clinical Impact
Abstract
This article provides a comprehensive guide for researchers and drug development professionals on the rigorous benchmarking of computational biology tools. It covers foundational principles, including the critical role of neutral benchmarks and stakeholder needs. The guide details methodological best practices for study design, dataset selection, and workflow formalization, and offers troubleshooting strategies for common technical and optimization challenges. Furthermore, it explores advanced topics in performance validation, metric selection, and the interpretation of comparative results. By synthesizing current literature and emerging practices, this resource aims to empower scientists to conduct transparent, reproducible, and impactful benchmarking studies that accelerate method development and enhance the reliability of computational findings in biomedical research.
The Why and Who: Establishing the Bedrock of Robust Benchmarking
For researchers, scientists, and drug development professionals, selecting the right computational tool is a critical decision that can directly impact research outcomes and resource allocation. Benchmarking provides the empirical evidence needed to make these choices confidently. In computational biology, two primary types of benchmarking studies have emerged: Methods-Development Papers (MDPs), where new methods are compared against existing ones, and Benchmark-Only Papers (BOPs), where existing methods are compared in a more neutral way [1] [2]. Understanding the distinction between these approaches and the fundamental requirement for neutrality forms the foundation for rigorous computational tool evaluation.
Frequently Asked Questions (FAQs)
Q1: What is the fundamental difference between an MDP and a BOP?
An MDP (Methods-Development Paper) is conducted by method developers to demonstrate the merits of their new approach compared to existing state-of-the-art and baseline methods [3]. Its primary focus is showcasing the new method's advantages. In contrast, a BOP (Benchmark-Only Paper) is a neutral study performed to systematically compare a set of existing methods, typically by independent groups without a vested interest in any particular tool's performance [1] [3]. BOPs aim to provide an impartial comparison for the benefit of the end-user community.
Q2: Why is neutrality so critical in benchmarking studies?
Neutrality is essential because it minimizes perceived bias and ensures results accurately reflect real-world performance [3]. Non-neutral benchmarks risk unfairly advantaging or disadvantaging certain methods through choices in datasets, evaluation metrics, or parameter tuning. This can mislead the scientific community and impede progress. Well-executed neutral benchmarks build trust, enhance transparency, and provide reliable guidance for researchers choosing computational methods [1] [2].
Q3: What are common sources of bias in benchmarking studies?
Common sources of bias include:
- Dataset Selection: Using datasets that disproportionately favor one method [3].
- Parameter Tuning: Extensively tuning parameters for a preferred method while using defaults for others [3].
- Ground Truth Definition: Using an inappropriate or biased definition of correctness [1].
- Implementation Variations: The same model yielding different performance scores across laboratories due to implementation differences rather than scientific factors [4].
Q4: How can a benchmarking ecosystem address current challenges?
A continuous benchmarking ecosystem provides standardized, community-driven platforms for evaluation [1] [4]. Such systems can:
- Formalize benchmark definitions through configuration files [1] [2].
- Orchestrate standardized workflows across reproducible software environments [2].
- Provide interactive results dashboards for flexible filtering and aggregation of metrics [1].
- Reduce redundancy by making existing results accessible and extendable, saving valuable research time [4].
Troubleshooting Common Benchmarking Issues
Problem: Inconsistent results when replicating a benchmark study.
- Cause: Variations in software environments, dependency versions, or computing hardware.
- Solution: Use containerization technologies (Docker, Singularity) and workflow systems (Nextflow, Snakemake, Common Workflow Language) to capture complete computational environments [1] [2]. The Chan Zuckerberg Initiative's benchmarking suite addresses this through standardized, modular packages that ensure consistent implementation [4].
Problem: Suspected bias in method comparison favoring a newly developed tool.
- Cause: The benchmark may be an MDP where parameters were extensively tuned for the new method while competing methods used default settings.
- Solution: Verify if the study follows neutral benchmarking guidelines [3]. Check if parameter tuning was performed equally for all methods or if the authors involved developers of competing methods to ensure optimal usage. For future studies, use blinded evaluation procedures where possible [3].
Problem: Benchmark results become stale quickly in a fast-moving field.
- Cause: New methods emerge rapidly after publication, making static comparisons outdated.
- Solution: Utilize or contribute to "living" benchmarking ecosystems designed for continuous integration of new methods and datasets [1] [4]. These systems allow benchmarks to evolve alongside the field, maintaining relevance through community contributions.
Problem: Difficulty determining which benchmarked method works best for your specific dataset.
- Cause: Method performance often depends on specific data characteristics, and published benchmarks may not include datasets similar to yours.
- Solution: Look for benchmarks that thoroughly characterize dataset properties and provide access to the code and software stack needed to apply methods to your data [1]. Flexible benchmarking systems allow filtering and aggregation of metrics based on data characteristics relevant to your research question.
Experimental Protocols for Rigorous Benchmarking
Protocol 1: Designing a Neutral Benchmarking Study
- Define Scope and Purpose: Clearly state whether the study is an MDP or BOP. For BOPs, aim for comprehensive method inclusion [3].
- Select Methods: Establish transparent inclusion criteria (e.g., software availability, installability) applied equally to all methods. For neutral benchmarks, include all available methods or a representative subset justified without favoritism [3].
- Collect Datasets: Include diverse datasets representing various conditions. Use both simulated data (with known ground truth) and real experimental data. Validate that simulated data accurately reflect properties of real data [3].
- Define Metrics: Select multiple complementary metrics to provide a thorough view of performance [4].
- Execute Workflow: Use standardized workflow systems to ensure consistent execution across methods [2].
- Analyze and Report: Contextualize results according to the benchmark's purpose. For BOPs, provide clear user guidelines and highlight method weaknesses for developers [3].
Protocol 2: Creating Experimental Datasets with Ground Truth
When suitable public datasets are unavailable, construct benchmarks with known ground truth:
- Spike-in Controls: Introduce synthetic RNA molecules at known concentrations in RNA-sequencing experiments [3].
- Fluorescence-Activated Cell Sorting: Sort cells into known subpopulations prior to single-cell RNA-sequencing [3].
- Cell Line Mixing: Create pseudo-cells by mixing different cell lines in known proportions [3].
- Sex Chromosome Genes: Use genes located on sex chromosomes as proxies for DNA methylation status [3].
Benchmarking Methodologies and Data Presentation
Table 1: Key Characteristics of MDPs vs. BOPs
| Characteristic | Methods-Development Papers (MDPs) | Benchmark-Only Papers (BOPs) |
|---|---|---|
| Primary Goal | Demonstrate new method advantages | Neutral comparison of existing methods |
| Typical Conductors | Method developers | Independent researchers or consortia |
| Method Selection | Representative subset (state-of-the-art, baseline) | Comprehensive, all available methods |
| Neutrality | Potential for bias (requires careful design) | High (explicitly designed for neutrality) |
| Community Involvement | Limited | Often high (may include method authors) |
| Result Interpretation | Highlights new method contributions | Provides user guidelines and identifies field gaps |
Table 2: Benchmark Dataset Types and Applications
| Dataset Type | Key Features | Performance Evaluation | Common Applications |
|---|---|---|---|
| Simulated Data | Known ground truth; customizable parameters | Direct comparison to known truth | Method validation; scalability testing |
| Real Experimental Data | Biological complexity; no perfect ground truth | Comparison to gold standard or consensus | Real-world performance assessment |
| Designed Experimental Data | Hybrid approach with introduced ground truth | Direct metrics against engineered truth | Controlled validation of specific capabilities |
Benchmarking Workflow and Stakeholder Relationships
Diagram 1: Benchmarking ecosystem workflow and stakeholder relationships.
The Scientist's Toolkit: Essential Research Reagent Solutions
Table 3: Key Components for Computational Benchmarking
| Component | Function | Implementation Examples |
|---|---|---|
| Workflow Systems | Orchestrate reproducible execution of methods | Common Workflow Language (CWL), Nextflow, Snakemake [2] |
| Containerization | Ensure consistent software environments | Docker, Singularity, Conda environments [1] |
| Benchmarking Suites | Provide standardized evaluation frameworks | CZI's cz-benchmarks Python package, community challenges [4] |
| Reference Datasets | Serve as ground truth for performance evaluation | Simulated data, spiked-in controls, sorted cell populations [3] |
| Performance Metrics | Quantify method performance across dimensions | Multiple complementary metrics per task [4] |
| Visualization Dashboards | Enable interactive exploration of results | Web-based interfaces for result filtering and comparison [1] [4] |
The field of computational biology is driven by a diverse ecosystem of stakeholders, each with unique needs, perspectives, and requirements. The ultimate goal of benchmarking computational biology tools is to evaluate and improve the performance, reliability, and applicability of software and algorithms used in biological research and clinical practice. This technical support center addresses the specific issues these stakeholders encounter, providing troubleshooting guidance and FAQs framed within the context of rigorous benchmarking research. The development of comprehensive benchmarks, such as BixBench—a dataset comprising over 50 real-world scenarios with nearly 300 questions designed to measure the ability of LLM-based agents to explore biological datasets—highlights the community's push toward more practical evaluation metrics beyond simple knowledge recall [5]. Effective implementation of these tools hinges on understanding and addressing the needs of all involved parties, from the developers creating algorithms to the clinicians applying them at the patient bedside [6] [7].
The computational biology landscape involves multiple stakeholder groups whose engagement is critical for successful tool implementation. A systematic review of stakeholder perspectives toward diagnostic artificial intelligence identified four primary groups: patients, clinicians, researchers, and healthcare leaders [6]. Each group possesses different priorities and concerns influencing their decision to adopt or not adopt computational technologies. The following table summarizes these key stakeholder groups and their primary needs within the computational biology tool ecosystem.
Table 1: Key Stakeholder Groups and Their Primary Needs
| Stakeholder Group | Primary Needs & Priorities | Key Concerns |
|---|---|---|
| Method Developers [5] [8] [9] | Robust benchmarking frameworks, standardized metrics, computational efficiency, algorithm scalability, reproducible research practices. | Tool performance, accuracy, robustness, interoperability, and adoption by the research community. |
| Bioinformatics Researchers [10] [8] [11] | User-friendly tools, comprehensive documentation, accessible data formats, clear troubleshooting guides, reproducible analytical workflows. | Data integration from disparate sources, tool usability, data quality, and normalization across different platforms [10]. |
| Clinicians [6] [7] | Seamless EHR integration, clinical decision support, interpretable results, workflow compatibility, evidence of clinical utility. | Trust in algorithm outputs, time efficiency, liability, and how the tool fits within existing clinical workflows and patient interactions [6] [7]. |
| Patients and the Public [6] [12] | Privacy and confidentiality, transparent data usage, understandable explanations of results, respect for autonomy. | Data security, potential for discrimination, and how their genetic or health information will be used and protected [6] [12]. |
| Healthcare Leaders [6] [7] | Cost-effectiveness, regulatory compliance, return on investment, operational efficiency, improved patient outcomes. | Financial sustainability, implementation costs, staff training requirements, and integration with existing health IT systems. |
Essential Tools and Research Reagents
Computational biology relies on a diverse toolkit of software and resources for analyzing biological data. The following table details key tools and their primary functions in standard computational biology workflows.
Table 2: Essential Computational Biology Tools and Resources
| Tool Name | Category | Primary Function | Application Context |
|---|---|---|---|
| BLAST [11] | Sequence Alignment & Analysis | Compares nucleotide or protein sequences to databases to identify regions of similarity. | Gene identification, functional analysis, and evolutionary studies. |
| GATK [11] | Genomic Analysis | Provides tools for variant discovery and genotyping from high-throughput sequencing data. | Variant calling in cancer genomics, population genetics, and personalized medicine. |
| DESeq2/edgeR [11] | Transcriptomics Analysis | Identifies differentially expressed genes from RNA-Seq count data using statistical modeling. | Gene expression studies to understand disease mechanisms and gene regulation. |
| Bioconductor [11] | Genomic Data Analysis | An open-source platform providing extensive R packages for high-throughput genomic analysis. | Comprehensive analysis and comprehension of diverse genomic data types. |
| KEGG [11] | Pathway & Functional Analysis | Integrates genomic, chemical, and systemic functional information for pathway mapping. | Functional annotation of genes, understanding disease mechanisms, and drug development. |
| EquiRep [8] | Specialized Genomic Analysis | Identifies repeated patterns in error-prone sequencing data to reconstruct consensus units. | Studying genomic repeats linked to neurological and developmental disorders. |
Troubleshooting Guides and FAQs
Frequently Asked Questions
Q1: Our clinical team is resistant to adopting a new genomic decision support tool. What implementation strategies are most effective?
- A: Successful implementation requires proactive stakeholder engagement across all phases. This includes involving clinical champions early in the decision process, conducting workflow analysis during pre-implementation, and establishing efficient feedback loops post-implementation to address usability concerns. Engaging organizational leadership is also crucial for allocating necessary resources and encouraging adoption [7].
Q2: We are getting inconsistent results when integrating data from different sequencing centers. What are the potential causes?
- A: Inconsistent results often stem from data normalization problems. Different instruments, laboratory protocols, or calibration methods can introduce systematic biases. Ensure that normalization procedures are applied to correct for these technical variations, and verify that all datasets are processed using compatible data standards and formats [10].
Q3: How can we assess the real-world performance of a computational biology tool beyond standard accuracy metrics?
- A: Frameworks like BixBench advocate for evaluation based on real-world biological scenarios that test a tool's ability to perform multi-step analytical trajectories and interpret nuanced results. Beyond accuracy, consider metrics for scalability, usability, interoperability, and robustness across diverse datasets [5] [9].
Q4: Our RNA-Seq analysis with DESeq2 is failing due to "missing values" errors. What should I check?
- A: This commonly occurs when the count matrix contains rows (genes) with zero counts across all samples. Filter out genes with minimal expression before analysis. You can use
rowSums(counts(matrix)) > 0to create a filtering index and subset your data to remove these genes, ensuring a valid statistical fit.
- A: This commonly occurs when the count matrix contains rows (genes) with zero counts across all samples. Filter out genes with minimal expression before analysis. You can use
Q5: A patient has expressed concern about how their genomic data will be stored and used in our research. How should we address this?
- A: Building trust through transparent communication is essential. Clearly explain how data will be anonymized, stored securely, and used only for the approved research purposes. Discuss the consent process in detail, including any options for future data use, and emphasize the measures in place to protect their confidentiality [12].
Troubleshooting Common Experimental and Workflow Issues
Table 3: Troubleshooting Guide for Common Computational Biology Problems
| Problem | Potential Causes | Solutions | Stakeholders Most Affected |
|---|---|---|---|
| High participant dropout in a longitudinal genomics study. | Poor participant rapport, high burden, inadequate communication, privacy concerns [12]. | Implement rules for building rapport and instilling autonomy. Simplify protocols, provide regular updates, and ensure transparent confidentiality safeguards. | Researchers, Patients |
| Inability to integrate heterogeneous biological datasets. | Lack of scalable data integration systems, incompatible data standards, non-uniform data models [10]. | Employ robust data integration systems that can transform retrieved data into a common model. Advocate for and adopt community-wide data standards. | Researchers, Method Developers |
| A clinical decision support alert for a drug-gene interaction is frequently overridden by clinicians. | Alert fatigue, poor integration into clinical workflow, lack of clinician trust or understanding of the underlying evidence [6] [7]. | Engage clinicians in the tool selection and design phase. Optimize alert specificity and provide concise, evidence-based explanations within the clinical workflow. | Clinicians, Healthcare Leaders |
| Variant calling tool (e.g., GATK) performs poorly on long-read sequencing data. | Tool algorithms may be optimized for specific sequencing technologies (e.g., short-reads) and may not handle the different error profiles of long-read data. | Consult tool documentation for compatibility. Explore specialized tools designed for long-read data or adjust parameters (e.g., error rates, mapping quality thresholds) if possible. | Researchers, Method Developers |
| A newly published benchmark ranks our tool lower than expected. | Differences in evaluation metrics, benchmark dataset composition, or workflow parameters compared to internal validation. | Critically analyze the benchmark's methodology, including the metrics of success and the representativeness of the test data. Use the findings to guide targeted improvements. | Method Developers |
Workflow and Stakeholder Engagement Diagrams
Computational Biology Tool Benchmarking Workflow
Stakeholder Engagement Framework for Implementation
A guide to constructing and troubleshooting rigorous, reproducible evaluations for computational biology tools.
In the fast-paced field of computational biology, benchmarking is the cornerstone of rigorous research. It provides the evidence needed to validate new computational methods, compare them against the state of the art, and guide users in selecting the right tool for their scientific question. This guide breaks down the core components of a successful benchmark and addresses common challenges researchers face.
Why is a formal benchmarking system necessary?
Traditional, one-off benchmarking studies often suffer from reproducibility challenges, implementation biases, and quickly become outdated. A systematic approach is needed because benchmarking involves more than just running workflows; it includes tasks like managing contributions, provisioning hardware, handling software environments, and rendering results dashboards [13]. A well-defined benchmarking system ensures fairness, reproducibility, transparency, and trust, ultimately accelerating scientific progress [1] [13].
Core Components of a Benchmark
A robust benchmark is built on four foundational pillars, each playing a critical role in ensuring a fair and informative evaluation [1].
| Component | Description | Key Considerations |
|---|---|---|
| Task | The specific problem the methods are designed to solve. | Must be well-defined and reflect a real-world biological or computational challenge [1]. |
| Datasets | The reference data used to evaluate the methods. | Include diverse, realistic data (simulated and real) with ground truth where possible [14] [15]. |
| Methods | The computational tools or algorithms being evaluated. | Ensure correct implementation and use of appropriate parameters in a reproducible software environment [1]. |
| Metrics | The quantitative measures used to assess method performance. | Should be aligned with the task and relevant to end-users. Using multiple metrics provides a holistic view [1] [4]. |
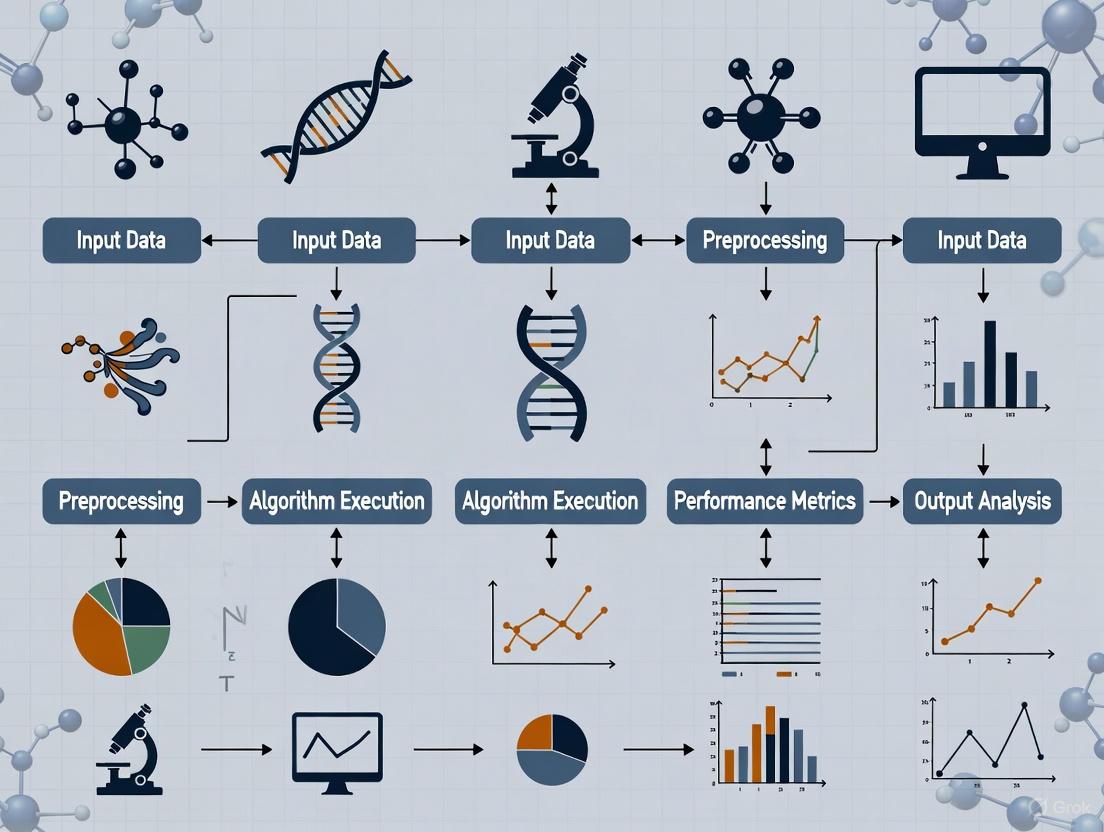
The relationship between these components and the benchmarking process can be visualized as a structured workflow.
Frequently Asked Questions (FAQs)
How can I ensure my benchmark is fair and not biased toward my own method?
- A: To ensure neutrality, use datasets that were not used in the development or training of the methods being evaluated. Rely on realistic simulated data or independent, real-world validation sets. Furthermore, a neutral benchmark should compare a new method against the current state of the art, not just older or weaker approaches [1]. Involving the community through platforms like OpenProblems.bio or CZI's benchmarking suite can also provide external oversight and validation [4] [16].
I'm benchmarking 14 methods. How do I manage the different software environments?
- A: This is a common challenge, as different tools often require conflicting software dependencies (e.g., R vs. Python versions). The key is to use technologies that containerize each method. Platforms like OpenProblems use Viash to automatically wrap code from different languages into portable, versioned containers (e.g., Docker). These containers are then executed within scalable workflow systems like Nextflow on platforms such as Seqera [16]. This approach ensures that each method runs in its own reproducible environment, making large-scale benchmarking feasible.
How do I choose the right metrics?
- A: Select metrics that are most relevant to the end-user, typically a biologist or data analyst. A single metric is rarely sufficient; instead, use a suite of metrics to evaluate different aspects of performance. For example, a comprehensive benchmark of tools for identifying Spatially Variable Genes (SVGs) used six different metrics to evaluate aspects like gene ranking, statistical calibration, and computational scalability [15]. The table below from that study shows how metrics can provide a multi-faceted view.
| Performance Aspect | Example Metric |
|---|---|
| Gene Ranking | Area under the precision-recall curve (AUPRC) |
| Statistical Calibration | P-value uniformity under null hypothesis |
| Scalability | Running time, Memory usage |
My benchmark results are inconsistent across datasets. What should I do?
- A: This is expected and actually highlights the importance of using multiple, diverse datasets. Method performance is often dependent on data characteristics, such as the technology used (e.g., sequencing- vs. imaging-based spatial transcriptomics) or the biological system [1] [15]. Your benchmark should characterize the datasets thoroughly and present results disaggregated by dataset. This helps users understand which method performs best under specific conditions relevant to their work.
How can I make my benchmark reproducible and extensible?
- A: Reproducibility starts with using a formal workflow system (e.g., Nextflow, Snakemake) and versioning all code and data. For extensibility, design your benchmark as a living, community-driven resource. This can be achieved by:
- Using a standardized configuration file to define all benchmark components [1].
- Creating a modular structure that allows others to easily contribute new methods, datasets, or metrics, as done in community platforms like OpenProblems.bio and CZI's benchmarking suite [4] [16].
- Publishing all components openly to adhere to FAIR principles (Findable, Accessible, Interoperable, and Reusable) [1].
The Scientist's Toolkit: Key Platforms & Reagents
Building a benchmark from scratch is complex. Leveraging existing community-driven platforms and tools can save immense time and effort.
| Tool / Platform | Function | URL |
|---|---|---|
| OpenProblems.bio | A living, community-run platform for benchmarking single-cell and spatial methods. Provides formalized tasks, curated datasets, and metrics. | https://openproblems.bio |
| CZI Benchmarking Suite | A standardized toolkit for benchmarking AI-driven virtual cell models, including tasks for cell type classification and perturbation prediction. | Chan Zuckerberg Initiative |
| Viash | A "code-to-pipeline" tool that wraps scripts (Python/R) into reproducible, containerized components, ready for workflow systems. | https://viash.io |
| Nextflow & Seqera | Workflow management system (Nextflow) and platform (Seqera) for orchestrating and scaling benchmarks elastically on cloud or HPC. | https://nextflow.io, https://seqera.io |
The Vision of a Continuous Benchmarking Ecosystem
Troubleshooting Guides and FAQs
This section addresses common technical and methodological issues encountered when setting up or participating in a continuous benchmarking ecosystem for computational biology tools.
Frequently Asked Questions (FAQs)
Q1: What is the primary purpose of a continuous benchmarking ecosystem in computational biology? A1: The primary purpose is to provide a systematic, neutral framework for evaluating the performance of computational methods against defined tasks and datasets. It aims to automate benchmark studies, ensure reproducibility through standardized software environments and workflows, and provide a platform for ongoing, community-driven method comparison, moving beyond one-off, publication-specific evaluations [1] [4].
Q2: We want to contribute a new dataset to an existing benchmark. What is the required metadata? A2: While specific requirements may vary, a comprehensive dataset for a benchmarking ecosystem should be accompanied by metadata that includes a detailed description of the experimental design, the biological system studied, data-generating technology, processing steps, and a clear definition of the ground truth or positive controls. This ensures the dataset is Findable, Accessible, Interoperable, and Reusable (FAIR) for the community [1].
Q3: What are the most common tools for managing benchmarking workflows?
A3: Workflow management systems are indispensable for creating reproducible and automated benchmarking pipelines. Common tools mentioned in the context of bioinformatics include Nextflow, Snakemake, and Galaxy [17]. The Chan Zuckerberg Initiative's benchmarking suite also offers command-line tools and Python packages (e.g., cz-benchmarks) for integration into development cycles [4].
Q4: How can we prevent overfitting to a static benchmark? A4: To prevent overfitting, a benchmarking ecosystem should be a "living, evolving" resource. This involves regularly incorporating new and held-out evaluation datasets, refining metrics based on community input, and developing tasks for emerging biological questions. This approach discourages optimization for a small, fixed set of tasks and promotes model generalization [4].
Q5: How do I ensure the results of my benchmark are reproducible? A5: Key practices include using version control for all code, explicitly documenting software versions and dependencies, using containerized environments, and thoroughly documenting all parameters and preprocessing steps. Workflow management systems can automate much of this, capturing the exact computational environment used [1] [17].
Troubleshooting Common Technical Issues
Table: Common Benchmarking Issues and Solutions
| Issue | Potential Causes | Diagnostic Steps | Solution |
|---|---|---|---|
| Pipeline Failure at Alignment Stage | Outdated reference genome index; Incorrect file formats; Insufficient memory [17]. | Check tool log files for error messages; Validate input file formats with tools like FastQC; Monitor system resources [17]. |
Rebuild reference index with updated tool version; Convert files to correct format; Allocate more computational resources or optimize parameters [17]. |
| Inconsistent Results Between Runs | Software version drift; Undocumented parameter changes; Random seed not fixed [1]. | Use version control to audit changes; Re-run in a containerized environment; Check for hard-coded paths. | Use container technology; Implement a formal benchmark definition file to snapshot all components; Set and document all random seeds [1]. |
| Poor Performance of New Method | Method is not suited for the dataset type; Incorrect implementation; Data quality issues [1]. | Compare method performance on different dataset classes; Validate implementation against a known simple case; Run data quality control (e.g., FastQC, MultiQC) [17]. |
Contribute to the benchmark by adding datasets where your method excels; Re-examine the method's core assumptions [1]. |
| Tool Dependency Conflicts | Incompatible versions of programming languages or libraries [17]. | Use dependency conflict error messages to identify problematic packages. | Use containerized environments or package managers to create isolated, reproducible software stacks [1] [17]. |
| High Computational Resource Use | Inefficient algorithm; Pipeline not optimized for scale; Data structures too large [17]. | Use profiling tools to identify bottlenecks; Check if data can be downsampled for testing. | Optimize code; Migrate to a cloud platform with scalable resources; Use more efficient data formats [17]. |
Experimental Protocols for Key Benchmarking Tasks
This section provides detailed methodologies for core experiments in a computational benchmarking study.
Protocol 1: Benchmarking a New Cell Clustering Method for Single-Cell RNA-Seq Data
Objective: To evaluate the performance of a new cell clustering algorithm against existing methods using a standardized benchmarking task.
Materials:
- Reference Dataset: A well-annotated single-cell RNA-seq dataset with known ground truth cell labels (e.g., from a cell line mixture or a highly characterized tissue).
- Computing Environment: A containerized environment with all necessary software dependencies.
- Workflow Management: A
SnakemakeorNextflowpipeline to orchestrate the analysis.
Procedure:
- Data Preprocessing: Run standard quality control and normalization on the reference dataset using the steps defined in the benchmark. This ensures all methods are evaluated on the same preprocessed data.
- Method Execution: Run the new clustering method and established baseline methods within the same computational environment. Key parameters for all methods should be documented.
- Metric Calculation: Compute a set of predefined metrics to evaluate the clustering results. Common metrics include:
- Adjusted Rand Index (ARI): Measures the similarity between the predicted clusters and the ground truth labels.
- Normalized Mutual Information (NMI): Another information-theoretic measure of cluster similarity.
- Cluster Purity: Measures the extent to which each cluster contains cells from a single class.
- Results Aggregation: Compile the results from all methods into a comparative report. The CZI benchmarking suite, for example, allows for easy comparison of one model’s performance against others on tasks like cell clustering [4].
Protocol 2: Evaluating a Variant Calling Pipeline
Objective: To assess the accuracy and efficiency of a genomic variant calling workflow.
Materials:
- Reference Data: A reference genome and a sequencing dataset (e.g., whole-genome sequencing) for a sample with a known set of true variants (e.g., from the Genome in a Bottle consortium).
- Tools: Alignment tools (
BWA,Bowtie2), variant callers (GATK,SAMtools), and benchmarking tools (hap.py).
Procedure:
- Data Alignment: Align the sequencing reads to the reference genome.
- Variant Calling: Execute the variant calling pipeline to identify single nucleotide polymorphisms and insertions/deletions.
- Performance Comparison: Compare the called variants against the known truth set to calculate performance metrics.
- Analysis: Analyze the results to identify strengths and weaknesses.
Table: Key Performance Metrics for Variant Calling Evaluation
| Metric | Formula | Interpretation |
|---|---|---|
| Precision | True Positives / (True Positives + False Positives) | Proportion of identified variants that are real. Higher is better. |
| Recall (Sensitivity) | True Positives / (True Positives + False Negatives) | Proportion of real variants that were identified. Higher is better. |
| F1-Score | 2 * (Precision * Recall) / (Precision + Recall) | Harmonic mean of precision and recall. Provides a single balanced score. |
System Diagrams and Workflows
Continuous Benchmarking Ecosystem Architecture
Benchmarking Workflow Execution Logic
The Scientist's Toolkit: Essential Research Reagents & Solutions
Table: Key Components of a Continuous Benchmarking Ecosystem
| Category | Item | Function |
|---|---|---|
| Computational Infrastructure | Workflow Management Systems (Nextflow, Snakemake) | Orchestrates complex analysis pipelines, ensuring reproducibility and portability across different computing environments [17]. |
| Container Technologies (Docker, Singularity) | Packages software and its dependencies into isolated, reproducible units, eliminating "it works on my machine" problems [1]. | |
| Cloud Computing Platforms (AWS, Google Cloud) | Provides scalable, on-demand resources for running large-scale benchmarks and storing massive datasets [17]. | |
| Data & Method Standards | Curated Reference Datasets | Provides the ground truth for evaluating method performance. These must be well-characterized and have clear definitions of correctness [1] [4]. |
| Community-Defined Tasks & Metrics | Formalizes the scientific question being evaluated (the task) and provides standardized, multi-faceted measures for assessing performance (the metrics) [4]. | |
| Benchmark Definition File | A single configuration file (e.g., YAML) that formally specifies all components of a benchmark: code versions, software environments, parameters, and datasets for a release [1]. | |
| Community & Governance | Version Control (Git) | Tracks changes to code, methods, and benchmark definitions, which is fundamental for reproducibility and collaboration [17]. |
| Interactive Reporting Dashboards | Allows users to explore and filter benchmarking results interactively, facilitating understanding and adoption by a broader audience, including non-experts [18] [4]. |
Blueprint for Success: Designing and Executing Your Benchmarking Study
Benchmarking is a critical, multi-faceted process in computational biology that serves distinct purposes for different stakeholders. At its core, a benchmark is a conceptual framework to evaluate the performance of computational methods for a given task, requiring a well-defined task and a definition of correctness or ground-truth [1]. These evaluations generally fall into two categories: Method-Development Papers (MDPs), where new methods are compared against existing ones, and Benchmark-Only Papers (BOPs), which provide a more neutral comparison of existing methods [1]. A robust benchmarking ecosystem must orchestrate workflow management, community engagement, and the generation of benchmark 'artifacts' like code snapshots and performance outputs systematically, adhering to standards of fairness, reproducibility, and transparency [1]. This technical support center is designed to help researchers navigate this complex landscape and troubleshoot common experimental issues.
Frequently Asked Questions (FAQs) on Benchmarking
1. What is the fundamental difference between a neutral comparison and a method introduction?
A method introduction (typically an MDP) is driven by method developers aiming to demonstrate their new tool's competitive advantage against existing state-of-the-art methods [1]. In contrast, a neutral comparison (BOP) is structured to impartially evaluate a set of existing methods, often using neutral datasets and metrics to avoid intrinsic bias, and is highly utilized and influential for guiding methodological developments [1].
2. Why is a formal 'benchmark definition' important?
A formal benchmark definition, which can be expressed as a configuration file, specifies the entire scope and topology of components to be included [1]. This includes details of code repositories with versions, instructions for creating reproducible software environments, parameters used, and which components to snapshot for a release. This formalization is key for ensuring reproducibility, transparency, and long-term maintainability [1].
3. Who are the primary stakeholders in a benchmarking ecosystem, and what are their needs?
- Data Analysts use benchmarks to select suitable methods for their specific datasets and analysis tasks. They benefit from benchmarks that include diverse, well-characterized datasets and flexible filtering of metrics [1].
- Method Developers require benchmarking to compare their new methods against the current state of the art in a neutral setting. A accessible ecosystem reduces redundancy and lowers the entry barrier for development [1].
- Journals & Funding Agencies rely on well-executed benchmarks to ensure published or funded methods meet high standards. They have a vested interest in results being FAIR (Findable, Accessible, Interoperable, and Reusable) to maximize community benefit [1].
Troubleshooting Common Benchmarking Workflow Errors
Issue 1: FASTA File Parsing Errors in Phylogenetic Tools
Error Message:
"Fasta parsing error, RAxML expects an alignment. the last sequence in the alignment seems to have a different length" [19]
Diagnosis and Solution: This error indicates that the sequences in your FASTA file are not properly aligned, meaning they do not have identical lengths. Even a single extra character in one sequence will cause the failure.
- Step 1: Validate Sequence Lengths. Manually check the length of each sequence in your file. Most sequence editors and command-line tools (like
awk) can report sequence lengths. - Step 2: Check for Non-Sequence Characters. Ensure the sequence data contains only valid IUPAC characters (A, T, G, C, N, etc.) and no spaces or other special characters within the sequence lines. The description header should be on a single line starting with ">", and the sequence itself should consist of only line breaks and valid nucleotides [20] [21].
- Step 3: Re-align Sequences. If sequences are unaligned, use a multiple sequence alignment tool (e.g., MUSCLE, MAFFT, Clustal Omega) before running the phylogenetic analysis.
Best Practice: Always use the NCBI-approved FASTA format: a definition line starting with ">" followed by a unique SeqID without spaces, and the sequence data using IUPAC symbols, with lines typically no longer than 80 characters [21].
Issue 2: BLAST Database Creation or Runtime Failures
Error Message:
"BLAST Database error: No alias or index file found for protein database [C:\Program] in search path..." [22]
Diagnosis and Solution: This error on Windows systems is commonly caused by spaces in the file path to your BLAST database or input files [22].
- Solution 1: Use Simple Directory Paths. Move your database and input files to a directory with a path that contains no spaces, for example,
C:\BLAST_DB\[22]. - Solution 2: Use Quotation Marks. When specifying paths in your BLAST command, enclose the entire path in double quotation marks.
- Solution 3: Check for Consistent Success. For intermittent BLAST failures, always check the exit status of the BLAST run. A non-zero exit code indicates an error. Capture standard error (STDERR) to a log file for detailed diagnostics [23].
Best Practice: Structure your BLAST projects in a simple, space-free directory hierarchy and implement error checking in your scripts.
Issue 3: Memory and Algorithm Errors in Multiple Sequence Alignment
Error Message:
"Fatal error, exception caught" or "Out of memory" during alignment with tools like MUSCLE or Clustal Omega, especially with long or highly divergent sequences [24].
Diagnosis and Solution: These errors occur when the alignment algorithm exhausts available system memory due to computational complexity.
- Solution 1: Use a Memory-Efficient Algorithm. Switch to an alignment method designed for larger datasets, such as the Mauve algorithm, or enable Brenner's alignment method, which uses less memory at the cost of some accuracy [24].
- Solution 2: Fragment Long Sequences. Break very long sequences into shorter, more manageable segments using tools like DNASTAR SeqNinja before attempting alignment [24].
- Solution 3: Allocate More Resources. If possible, run the alignment on a machine with more RAM.
Experimental Protocols for Key Benchmarking Tasks
Protocol 1: Designing a Neutral Benchmarking Study
Objective: To impartially compare the performance of a set of existing computational methods on a defined biological task.
Methodology:
- Task and Ground Truth Definition: Precisely define the biological task (e.g., gene expression quantification, variant calling, phylogenetic inference) and establish a trusted ground-truth dataset. This could be simulated data or a well-curated experimental dataset with known answers [1].
- Component Selection: Assemble the benchmark components [1]:
- Datasets: Select a diverse set of input datasets that reflect real-world variability.
- Methods: Choose a representative set of existing methods to be compared.
- Metrics: Define a set of performance metrics (e.g., sensitivity, precision, F1-score, runtime, memory usage).
- Workflow Orchestration: Execute all methods on all datasets using a workflow management system (e.g., Nextflow, Snakemake) within containerized software environments (e.g., Docker, Singularity) to ensure reproducibility [1].
- Result Aggregation and Analysis: Collect all performance metrics. Use flexible ranking and aggregation approaches to allow different stakeholders to assess methods based on metrics relevant to their needs [1].
Protocol 2: Incorporating a New Method into an Existing Benchmark
Objective: To integrate a newly developed method into a continuous benchmarking ecosystem for comparison with the state of the art.
Methodology:
- Benchmark Definition Access: Obtain the configuration file or specification of the existing benchmark, which defines the software environments, datasets, parameters, and metrics [1].
- Method Packaging: Package the new method such that it adheres to the input/output specifications and can be executed within the defined software environment of the benchmark.
- Integration and Execution: Integrate the new method's code into the benchmark's workflow. The system will then automatically run the new method on all specified datasets.
- Result Inclusion and Snapshotting: The results for the new method are incorporated into the benchmarking system's results. A snapshot of the entire benchmark, including the new method, can be generated for publication, ensuring reproducibility at that point in time [1].
Workflow and Relationship Diagrams
Benchmarking Ecosystem Logical Workflow
The following diagram illustrates the logical workflow and decision points in a continuous benchmarking ecosystem.
Research Reagent Solutions for Benchmarking
The following table details key computational "reagents" and materials essential for conducting robust benchmarking studies in computational biology.
| Item | Function in Benchmarking | Specification Notes |
|---|---|---|
| Reference Datasets | Provides the input data and ground truth for evaluating method performance. | Include both simulated and curated experimental datasets. Must be well-characterized and representative of real-world data [1]. |
| Software Containers | Ensures reproducible software environments across different computing architectures. | Use Docker or Singularity images with pinned versions of all software dependencies [1]. |
| Workflow Management System | Automates the execution of methods on datasets, ensuring consistency and scalability. | Examples: Nextflow, Snakemake, or CWL. Manages complex, multi-step analyses [1]. |
| Benchmark Definition File | Formally specifies the entire set of components and topology of the benchmark. | A single configuration file (e.g., YAML, JSON) that defines code versions, parameters, and snapshot rules [1]. |
| Performance Metrics | Quantifies the performance of methods, allowing for neutral comparison. | Should include a diverse set (e.g., accuracy, speed, memory usage) to allow for flexible, stakeholder-specific ranking [1] [19]. |
Frequently Asked Questions
How do I define the scope of my benchmark to guide method selection? The purpose of your benchmark is the most important factor determining which methods to include. Generally, benchmarks fall into one of two categories, each with different inclusion strategies [3]:
- Neutral Benchmarks: The goal is to provide a systematic, unbiased comparison for the community. You should strive to be as comprehensive as possible, including all available methods for a given type of analysis.
- Method Development Benchmarks: The goal is to demonstrate the relative merits of a new method. It is acceptable to include a representative subset of existing methods, such as current best-performing methods, widely used tools, and simple baseline methods.
What are the minimum criteria a method should meet to be included? To ensure fairness and practicality, you should define clear, justified inclusion criteria that do not favor any specific method. Common criteria include [3]:
- The software implementation is freely available.
- It can be successfully installed and executed without errors after a reasonable amount of troubleshooting.
- It is accessible for commonly used operating systems.
What should I do if a method is difficult to install or run? Document these efforts thoroughly in a log file. This transparency saves other researchers time and provides valuable context if a widely used method must be excluded. Involving the method's authors can sometimes help resolve technical issues [3] [25].
How can I avoid bias when selecting a representative subset of methods? When you cannot include all methods, avoid selecting tools based solely on personal preference. Instead, use objective measures to guide your selection [25]:
- Popularity: Consider the number of citations or widespread community adoption.
- Performance Claims: Include methods that have claimed to be state-of-the-art in their publications.
- Representativeness: Ensure the selected set covers different algorithmic approaches (e.g., deep learning, random forests, statistical models) and data types.
What is the "self-assessment trap" and how can I avoid it? The "self-assessment trap" refers to the inherent bias introduced when developers benchmark their own new method, as they are almost guaranteed to show it performs well. To ensure neutrality [26] [27]:
- If you are benchmarking a method you developed, this must be stated prominently as a caveat.
- The ideal neutral benchmark is conducted by researchers who are equally familiar with all included methods or, alternatively, in collaboration with the original method authors to ensure each tool is evaluated under optimal conditions [3].
Research Reagent Solutions
The table below lists key resources and their functions for conducting a robust benchmarking study.
| Item | Function in Benchmarking |
|---|---|
| Literature Search Tools (e.g., PubMed) | To compile a comprehensive list of existing methods and their publications for inclusion [25]. |
| Software Repository (e.g., GitHub, Bioconda) | To access the software implementations of the methods to be benchmarked. |
| Log File | To document the process of installing, running, and excluding methods, ensuring transparency and reproducibility [25]. |
| Containerization Tools (e.g., Docker, Singularity) | To package software with all its dependencies, ensuring a reproducible and portable computational environment across different systems [1] [25]. |
| Spreadsheet for Metadata | To summarize key information about the benchmarked algorithms, including underlying methodology, software dependencies, and publication citations [25]. |
| Compute Cluster/Cloud Environment | To provide the necessary computational power and scalability for running multiple methods on various benchmark datasets. |
Experimental Protocol for Method Selection
Objective: To establish a systematic, transparent, and reproducible protocol for selecting computational methods to include in a benchmarking study.
Procedure:
- Define Benchmark Purpose: Clearly document whether the study is a neutral comparison or for method development, as this dictates the scope of inclusion [3].
- Conduct Literature Review: Perform a systematic search on platforms like PubMed to identify all potentially relevant methods. Review the references of identified publications to find additional tools [25].
- Establish Inclusion/Exclusion Criteria: Pre-define objective criteria for method inclusion, such as public availability and installability. Justify any exclusion of widely used methods [3].
- Document the Selection Process: Maintain a log file that records every method considered, the outcome of the inclusion criteria check, and notes on any installation or runtime failures [25].
- Create a Benchmarking Spreadsheet: Populate a spreadsheet with key metadata for each included method, such as the underlying algorithm, required dependencies, and parameters [25].
- Engage the Community (Optional but Recommended): For neutral benchmarks, widely announce the study to invite participation from method authors. This can help ensure optimal tool execution and comprehensive inclusion [3].
Workflow for Unbiased Method Selection
The diagram below outlines the logical workflow for selecting methods in a benchmarking study.
Frequently Asked Questions
What is "ground truth" and why is it critical for benchmarking? Ground truth refers to data that is known to be factual and represents the expected, correct outcome for the system being evaluated. It serves as the "gold standard" or "correct answer" against which the performance of computational methods is measured [28] [29] [25]. In machine learning, it is essential for training, validating, and testing AI models to ensure their predictions reflect reality [28]. In bioinformatics benchmarking, it allows for the calculation of quantitative performance metrics to determine how well a method recovers a known signal [3] [25].
I have a new computational method. Should I benchmark it with simulated or real data? The most rigorous benchmarks typically use a combination of both. Each type has distinct advantages and limitations, and together they provide a more complete picture of a method's performance [3] [25]. Simulated data allows for precise, quantitative evaluation because the true signal is known, while real data tests the method's performance under realistic biological complexity [3].
How can I generate ground truth when it's not experimentally available? For some analyses, you can design experimental datasets that contain a built-in ground truth. Common strategies include:
- Spiking-in synthetic molecules at known concentrations in sequencing experiments [3].
- Using fluorescence-activated cell sorting (FACS) to sort cells into known subpopulations before single-cell RNA-sequencing [3].
- Leveraging biological knowledge, such as genes on sex chromosomes as a proxy for DNA methylation status [3].
- Employing Large Language Models (LLMs) to automate ground truth generation from source documents, followed by human review by subject matter experts to ensure accuracy (a human-in-the-loop process) [29].
A benchmark I want to use seems out of date. How can I contribute? The field is moving towards continuous benchmarking ecosystems. These are platforms designed to be public, open, and allow for community contributions. You can propose corrections to existing benchmarks, add new methods for comparison, or introduce new datasets. This approach helps keep benchmarks current and valuable for the entire community [1].
Troubleshooting Guides
Issue 1: My method performs well on simulated data but poorly on real data.
This is a common problem that often points to a poor simulation model or a flaw in the benchmarking design.
- Potential Cause 1: The simulation is overly simplistic. The simulated data fails to capture key properties of real biological data [3] [25].
- Solution: Before relying on simulation results, validate that your simulated datasets accurately reflect relevant properties of real data. Use empirical summaries (e.g., dropout profiles for single-cell RNA-seq, dispersion-mean relationships) to compare your simulated data against real experimental data [3].
- Potential Cause 2: Discrepancy between simulated and real-world dynamics. The assumptions used to generate the simulated data do not hold in a real-world setting [30].
Issue 2: I cannot find a pre-existing dataset with a reliable ground truth for my specific problem.
- Potential Cause: Gold standard experimental data can be prohibitively expensive or complex to generate for some applications [25].
- Solution: Consider a human-in-the-loop (HITL) pipeline for ground truth generation. This involves using a combination of automation and expert curation [29].
- Use a prompt-based strategy with an LLM to generate initial question-answer-fact triplets from your source data [29].
- Implement a scalable, automated pipeline to process large amounts of data [29].
- Have subject matter experts review a sample of the generated ground truth to verify that critical business or biological logic is correctly represented. The required level of review is determined by the risk of having incorrect ground truth [29].
- Solution: Consider a human-in-the-loop (HITL) pipeline for ground truth generation. This involves using a combination of automation and expert curation [29].
Issue 3: The benchmarking results are inconsistent and hard to reproduce.
- Potential Cause: Lack of standardized software environments and computational workflows.
- Solution: Adopt modern benchmarking systems that use containerization (e.g., Docker). This packages software with all its dependencies, ensuring the tool runs identically across different platforms and operating systems. This practice increases the transparency and computational reproducibility of benchmarking studies [1] [25].
Data Selection Guide: Simulated vs. Real Data
The table below summarizes the core characteristics, advantages, and limitations of simulated and real datasets to guide your selection.
| Feature | Simulated Data | Real Data |
|---|---|---|
| Ground Truth | Known by design [3] | Often unknown or imperfect; must be established [3] |
| Core Advantage | Enables precise, quantitative performance evaluation [3] | Tests performance under realistic, biological complexity [3] [25] |
| Data Complexity | Can be overly simplistic and fail to capture true experimental variability [25] | Inherently complex, containing technical noise and biological variation [25] |
| Control & Scalability | Full control; can generate unlimited data to study variability [3] | Limited by cost and ethics of experiments; fixed in size [25] |
| Primary Risk | Models used for simulation can introduce bias, making results irrelevant to real-world use [25] | Lack of known ground truth can make quantitative evaluation difficult or impossible [3] |
| Best Uses | Testing scalability, stability, and performance under idealized conditions; method development [3] | Final validation of methods; evaluating biological plausibility of results [3] |
Experimental Protocols for Ground Truth Generation
Protocol 1: Generating Ground Truth from Source Documents using LLMs
This protocol is adapted from best practices for evaluating generative AI question-answering systems and can be adapted for biological knowledge bases [29].
- Define Objective and Requirements: Clearly define the model's goals and the types of data and labels required.
- Develop a Labeling Strategy: Create standardized guidelines for how to annotate various data formats to ensure consistency.
- Automated Generation with an LLM:
- Input: Chunks of source data (e.g., scientific literature, database entries).
- Process: Use a base LLM prompt template that instructs the model to take a fact-based approach. The LLM is assigned a persona to identify facts (entities) from the source and assemble them into question-answer-fact triplets.
- Output: The generation output is formatted as fact-wise JSONLines records.
- Human-in-the-Loop (HITL) Review: Subject matter experts (SMEs) review a sample of the generated ground truth. They verify that the questions are fundamental and that the answers align with biological knowledge and business value. The level of review is based on the risk of incorrect ground truth.
- Address Bias: Use multiple, diverse annotators for each data point and employ data augmentation strategies for underrepresented groups to minimize bias in the ground truth dataset.
Protocol 2: Establishing Ground Truth in Bioimage Analysis
The Broad Bioimage Benchmark Collection (BBBC) provides standardized methodologies for different types of ground truth [31].
- For Object Counts:
- Method: Have one or more humans count the number of cells/objects in each image.
- Ground Truth: The mean of the human counts is used.
- Benchmarking Metric: Calculate the mean error (in percent) of the algorithm's count compared to the ground truth across all images.
- For Foreground and Background Segmentation:
- Method: A human produces a binary (black and white) image where foreground pixels (objects) are white and background pixels are black.
- Benchmarking Metric: Report precision, recall, and the F-factor (harmonic mean of precision and recall). Tools like CellProfiler's
CalculateImageOverlapmodule can be used.
- For Biological Labels (e.g., in a dose-response assay):
- Method: Use control samples with known expected biological results.
- Benchmarking Metric: Calculate the Z'-factor (if multiple positive and negative controls are available) or the V-factor (for dose-response curves). These statistics measure how well an algorithm separates controls given the biological variation.
The workflow for selecting and validating a dataset for benchmarking is summarized in the following diagram.
The Scientist's Toolkit: Research Reagent Solutions
| Item | Function |
|---|---|
| Containerization Software (e.g., Docker) | Creates reproducible software environments by packaging a tool with all its dependencies, ensuring consistent execution across different computers [1] [25]. |
| Workflow Management Systems | Orchestrates and automates the execution of complex benchmarking workflows, connecting datasets, methods, and computing infrastructure [1]. |
| Ground Truth Generation Pipeline | A serverless batch architecture (e.g., using AWS Step Functions, Lambda, Amazon S3) that automates the ingestion, chunking, and prompting of LLMs to generate ground truth data at scale [29]. |
| CellProfiler Software | An open-source bioimage analysis package that provides modules for calculating benchmarking metrics like image overlap, Z'-factor, and V-factor against manual ground truth [31]. |
| FMEval | A comprehensive evaluation suite that provides standardized implementations of metrics to assess the quality and responsibility of AI models, such as Factual Knowledge and QA Accuracy [29]. |
| Continuous Benchmarking Platform | A computational platform designed to orchestrate benchmark studies, allowing components to be public, open, and accepting of community contributions to keep benchmarks current [1]. |
Technical Comparison at a Glance
The table below summarizes the core characteristics of CWL, Snakemake, and Nextflow to aid in selection and troubleshooting.
| Feature | Common Workflow Language (CWL) | Snakemake | Nextflow |
|---|---|---|---|
| Primary Language | YAML/JSON (Declarative) [32] | Python-based DSL [33] | Apache Groovy-based DSL [34] |
| Execution Model | Command-line tool & workflow wrappers [32] | Rule-based, file-directed dependency graph [35] | Dataflow (Reactive) model via processes & channels [34] |
| Key Strength | Vendor-neutral, platform-agnostic standard [32] | Human-readable syntax and direct Python integration [33] [35] | Unified parallelism and implicit scalability [36] [34] |
| Software Management | Supports Docker & SoftwareRequirement (in specs) [37] | Integrated Conda & container support [33] [35] | Native support for Docker, Singularity, Conda [36] [34] |
| Portability | High (Specification-based, multiple implementations possible) [32] | High (Profiles for cluster/cloud execution) [33] | High (Abstraction layer for many platforms) [36] [34] |
Frequently Asked Questions & Troubleshooting
This section addresses common specific issues users might encounter during their experiments.
Q1: My CWL workflow fails with a "Not a valid CWL document" error. What should I check?
This is often a syntax or structure issue. First, verify that your document's header includes the mandatory cwlVersion and class fields (e.g., class: CommandLineTool or class: Workflow) [32] [37]. Second, ensure your YAML is correctly formatted; misplaced colons or incorrect indentation are common culprits. Use a YAML linter or the --validate flag in cwltool to check for errors.
Q2: How can I force Snakemake to re-run a specific rule even if the output files exist?
You can use the --force command-line flag to force the re-execution of all rules. To target a single rule and all rules that depend on its output, use the --forceall flag and specify the rule name or one of its output files (e.g., snakemake --forceall my_rule).
Q3: My Nextflow process is not running in parallel as expected. What is the most common cause?
This is typically due to how input channels are defined. Nextflow's parallelism is driven by its channels. If you use a value channel (created by default when you provide a simple value or a single file), the process is executed only once. To enable parallelism, ensure your inputs are provided via queue or channel declarations, which create a value channel for each item, triggering multiple process executions [34]. For example, use Channel.fromPath("*.fastq") instead of a direct file path.
Q4: How do I manage different software versions for different steps in my workflow? All three tools integrate with containerization to solve this:
- CWL: Use the
DockerRequirementin therequirementssection of aCommandLineToolto specify a unique Docker image for that step [37]. - Snakemake: Use the
container:directive within a rule to define a container image specifically for that rule's execution [33] [35]. - Nextflow: Use the
containerdirective within a process definition. Each process can have its own container, isolating its software environment [36] [34].
Q5: The cluster job scheduler kills my Snakemake/Nextflow jobs without an error. How can I debug this? This often relates to insufficient requested resources. Both tools allow you to dynamically request resources.
- In Snakemake, you can define resource requirements (e.g., memory, runtime) within rules and use a
--cluster-configfile or a profile to map these to your scheduler's commands [33]. - In Nextflow, you can define computational resources (
cpus,memory,time) for each process in the process definition itself, and Nextflow will translate these into directives for the underlying executor (SLURM, PBS, etc.) [34]. Check your executor's logs for the exact submission command that failed.
Experimental Protocols for Benchmarking
For a robust thesis benchmarking these tools, the following methodological approach is recommended.
1. Workflow Selection and Design Select a representative, multi-step computational biology workflow, such as a DNA-seq alignment and analysis pipeline (e.g., from FASTQ to sorted BAM and variant calling) [37]. Implement the exact same workflow logic in CWL, Snakemake, and Nextflow. Key steps should include file decompression, read alignment, file format conversion, sorting, and indexing to test a variety of operations [37].
2. Performance Metrics Quantify the following metrics across multiple runs:
- Total Wall-Time: From workflow launch to final output.
- CPU/Memory Efficiency: Ratio of actual resource use to allocated resources.
- Overhead: Time spent by the workflow engine itself on scheduling and management, distinct from the tool execution time.
- Scaling Efficiency: How performance changes when moving from a local machine to a cluster, measured by speedup and parallel efficiency.
- Resume Efficiency: Time taken to successfully recover and continue from a simulated failure.
3. Usability and Reproducibility Assessment
- Code Complexity: Measure lines of code and cyclomatic complexity for each implementation.
- Portability: Test the workflow on at least two different execution environments (e.g., local and a cloud batch service like AWS Batch) [36] [34].
- Reproducibility: Verify that identical results are produced across all three implementations and execution platforms.
The Scientist's Toolkit: Essential Research Reagents
The table below details key "reagents" or components essential for building and running formalized workflows.
| Item / Solution | Function / Purpose |
|---|---|
cwltool |
The reference implementation of the CWL specification, used to execute CWL-described tools and workflows [32]. |
| Conda / Bioconda | A package manager and a repository of bioinformatics software. Used by Snakemake and Nextflow to manage software dependencies in an isolated manner [33] [38]. |
| Docker / Singularity | Containerization technologies that encapsulate the entire software environment, ensuring absolute portability and reproducibility across different compute infrastructures [36] [34] [37]. |
| Inputs Object File (JSON/YAML) | In CWL, a file that provides the specific input values (e.g., file paths, parameters) for a workflow run, separate from the workflow logic itself [32]. |
| Profile (Snakemake) | A configuration file that persists settings (like executor options or resource defaults) for a specific execution environment (e.g., SLURM cluster), avoiding the need for long command-line invocations [33]. |
| Executor (Nextflow) | The component that determines where and how the workflow processes are run (e.g., local, slurm, awsbatch). It abstracts the underlying platform, making the workflow definition portable [34]. |
| Process & Channel (Nextflow) | The core building blocks. A process defines a single computational task, while a channel connects processes, enabling the reactive dataflow model and implicit parallelism [34]. |
| Rule (Snakemake) | The core building block of a Snakemake workflow. A rule defines how to create output files from input files using shell commands, scripts, or wrappers [35]. |
Workflow System Logical Flow
The following diagram visualizes the high-level logical flow and decision points within each workflow system, helping to conceptualize their operational models.
Diagram: Conceptual Execution Models of CWL, Snakemake, and Nextflow. CWL uses a runner to interpret declarative steps. Snakemake builds a file-based execution graph from a target. Nextflow processes are triggered reactively by data flowing through channels.
Implementing FAIR Principles for Findable, Accessible, Interoperable, and Reusable Results
Troubleshooting Guides and FAQs for FAIR Benchmarking
Findability Issues
Problem: My benchmarked results and workflow cannot be found by colleagues or automated systems.
| Solution Component | Implementation Example | Tools & Standards |
|---|---|---|
| Persistent Identifiers (PIDs) | Assign a DOI to your entire benchmarking workflow, including datasets, code, and results. | DOI, WorkflowHub [39] |
| Rich Metadata | Describe the benchmark using domain-specific ontologies (e.g., EDAM for bioinformatics) in a machine-readable format. | Bioschemas, RO-Crate [39] |
| Indexing in Repositories | Register the workflow in a specialized registry like WorkflowHub instead of a general-purpose repository like GitHub. | WorkflowHub, Zenodo [39] |
Q: What is the most common mistake that makes a benchmark unfindable? A: The most common mistake is depositing the workflow and results in a general-purpose repository without a persistent identifier or rich, structured metadata. A GitHub repository alone is insufficient for findability. The workflow and its components must be deposited in a recognized registry with a DOI and descriptive metadata that allows both people and machines to understand its purpose and content [40] [39].
Q: My benchmark uses multiple tools; what exactly needs a Persistent Identifier (PID)? A: For a composite object like a benchmark, PIDs should be assigned at multiple levels for optimal findability and credit:
- The overall workflow specification [40].
- The input and reference datasets used [39].
- The individual software components and tools that are part of the workflow [40].
- The final output and performance results [41].
Accessibility Issues
Problem: Users can find my benchmark's metadata but cannot access the data or code to run it themselves.
| Solution Component | Implementation Example | Tools & Standards |
|---|---|---|
| Standard Protocols | Ensure data and code are retrievable via standard, open protocols like HTTPS. | HTTPS, APIs |
| Authentication & Authorization | Implement controlled access for sensitive data, with clear instructions for obtaining permissions. | OAuth, Data Use Agreements |
| Long-Term Preservation | Use trusted repositories that guarantee metadata accessibility even if the data itself becomes unavailable. | WorkflowHub, Zenodo, ELIXIR Repositories [39] |
Q: My benchmark data is sensitive. Can it still be FAIR? A: Yes. FAIR does not necessarily mean "open." The "Accessible" principle requires that data and metadata are retrievable through a standardized protocol, which can include authentication and authorization layers. The metadata should remain openly findable, with clear instructions on how authorized users can request access to the underlying data [42] [43].
Q: I've shared my code on GitHub. Is my benchmark now accessible? A: Not fully. While GitHub uses standard protocols, it is not a preservation repository. For true, long-term accessibility, you should deposit a specific, citable version of your code in a trusted repository that provides a Persistent Identifier (like a DOI) and has a commitment to long-term archiving, such as WorkflowHub or Zenodo [39].
Interoperability Issues
Problem: My benchmark workflow produces results that cannot be integrated with other tools or datasets, limiting its utility.
| Solution Component | Implementation Example | Tools & Standards |
|---|---|---|
| Standard Workflow Language | Define the workflow using a common, portable language like CWL. | Common Workflow Language (CWL), Snakemake, Nextflow [39] |
| Standardized Vocabularies | Annotate inputs, outputs, and parameters using community-accepted ontologies. | EDAM Ontology, OBO Foundry Ontologies |
| Containerization | Package software dependencies in containers to ensure consistent execution across platforms. | Docker, Singularity [39] |
Q: What is the single most effective step to improve my benchmark's interoperability? A: Using a standard workflow language like the Common Workflow Language (CWL) is highly recommended. This abstracts the workflow logic from the underlying execution engine, allowing the same benchmark to be run seamlessly across different computing platforms and by other researchers, thereby dramatically increasing interoperability [39].
Q: How can I make my benchmark's results interoperable for future meta-analyses? A: Provide the performance results (e.g., accuracy, runtime) in a structured, machine-readable format like JSON or CSV, rather than only within a PDF publication. Use standard column names and data types. This makes it easy for others to automatically extract and combine your results with those from other benchmarks [41].
Reusability Issues
Problem: Others can access my benchmark but cannot successfully reproduce or reuse it for their own research questions.
| Solution Component | Implementation Example | Tools & Standards |
|---|---|---|
| Clear Licensing | Attach an explicit software license (e.g., MIT, Apache 2.0) and data license to the workflow and its components. | Creative Commons, Open Source Licenses |
| Provenance Capture | Use a workflow system that automatically records the data lineage, including all parameters and software versions used. | RO-Crate, CWL Prov, WMS Provenance Features [40] |
| Comprehensive Documentation | Include a "README" with exact commands, example input data, and expected output. | Markdown, Jupyter Notebooks |
Q: I've provided my code and data. Why are users still reporting they can't reuse my benchmark? A: This is often due to missing computational context. You likely provided the "what" (code and data) but not the precise "how" (exact software environment). To enable reuse, you must document the complete software environment, ideally by using container images (e.g., Docker) and a workflow management system that captures the full provenance of each execution run [40] [41].
Q: What critical reusability information is most often overlooked? A: Licensing. Without a clear license, potential users have no legal permission to reuse and modify your workflow. Always include a license file specifying the terms of use for both the code (e.g., an open-source license) and the data (e.g., CCO, CC-BY). This is a foundational requirement for reusability [40].
Experimental Protocol: FAIRifying a Computational Benchmark
The following methodology outlines the steps to implement the FAIR principles for a computational biology tool benchmark, using a metabolomics workflow as a case study [39].
Workflow Definition and Containerization
- Define the Workflow: Implement the benchmark workflow using a standard workflow language such as the Common Workflow Language (CWL). This ensures the workflow is abstracted from a specific execution engine [39].
- Package Components: For each analytical step (e.g., a tool for differential expression analysis), create a Docker or Singularity container that encapsulates all necessary software dependencies, ensuring consistent execution across platforms [39].
Metadata Generation and Registration
- Create Structured Metadata: Generate a machine-readable metadata file describing the benchmark. Use the Workflow RO-Crate profile, which uses Bioschemas to structure information like name, creator, description, and input/output data types in JSON-LD format [39].
- Register the Workflow: Submit the workflow and its RO-Crate to a dedicated registry like WorkflowHub. This platform will assign a Persistent Identifier (DOI), making the workflow findable and citable [39].
Execution and Provenance Capture
- Execute with a CWL-engine: Run the benchmark using a CWL-compliant workflow management system (e.g.,
cwltool). This ensures portability and, critically, allows the system to automatically collect provenance information [39]. - Package Results: The final output, including the provenance trace of the run, input data, and result metrics, should be bundled as a new Research Object Crate (RO-Crate). This crate is the reusable and reproducible artifact of your benchmark [39].
Workflow Diagram for FAIR Benchmark Implementation
The following diagram visualizes the key stages and decision points in the FAIR implementation protocol.
Essential Research Reagent Solutions for FAIR Benchmarks
The following table details key digital "reagents" and tools required to construct a FAIR computational benchmark.
| Item / Solution | Function in a FAIR Benchmark |
|---|---|
| Common Workflow Language (CWL) | A standard, portable language for describing analysis workflows, ensuring they can be run across different software environments [39]. |
| WorkflowHub | A registry for storing, sharing, and publishing computational workflows. It assigns PIDs and uses RO-Crate for packaging, directly supporting findability and reuse [39]. |
| Research Object Crate (RO-Crate) | A structured method to package a workflow, its data, metadata, and provenance into a single, reusable, and citable unit [39]. |
| Docker / Singularity | Containerization platforms that package software and all its dependencies, guaranteeing that the computational environment is reproducible and interoperable across systems [39] [41]. |
| Bioschemas | A project that defines standard metadata schemas (using schema.org) for life sciences resources, making workflows and datasets easily discoverable by search engines and databases [39]. |
| Zenodo | A general-purpose open-data repository that provides DOIs for data and software, facilitating long-term accessibility and citability for input datasets and output results [39]. |
Navigating Pitfalls: Solving Common Technical and Analytical Challenges
Avoiding the Self-Assessment Trap and Other Biases
In computational biology, the "self-assessment trap" is a widespread phenomenon where researchers who develop new analytical methods are also required to evaluate their performance against existing methodologies. This often leads to a situation where the authors' new method unjustly appears to be the best in an unreasonable majority of cases [44]. This bias frequently stems from selective reporting of performance metrics where the method excels, while neglecting areas where it performs poorly [44]. Beyond self-assessment, other biases like information leak (where test data improperly influences method development) and overfitting (where models perform well on training data but fail to generalize) further compromise the validity of computational evaluations [44]. Understanding and mitigating these biases is crucial for advancing predictive biology and ensuring robust scientific discovery.
Quantitative Evidence: The Prevalence of the Self-Assessment Trap
A survey of 57 peer-reviewed papers reveals the extent of the self-assessment trap across computational biology. The table below summarizes how the number of performance metrics used in evaluation affects the reported superiority of the authors' method [44].
Table 1: The Relationship Between Performance Metrics and Self-Assessment Outcomes
| Number of Performance Metrics | Total Studies Surveyed | Authors' Method is Best in All Metrics | Authors' Method is Best in Most Metrics |
|---|---|---|---|
| 1 | 25 | 19 (76%) | 6 (24%) |
| 2 | 15 | 13 (87%) | 2 (13%) |
| 3 | 7 | 4 (57%) | 3 (43%) |
| 4 | 4 | 1 (25%) | 3 (75%) |
| 5 | 4 | 1 (25%) | 3 (75%) |
| 6 | 2 | 1 (50%) | 1 (50%) |
The data demonstrates a clear trend: as the number of performance metrics increases, the likelihood of a method being superior across all metrics drops substantially. With only one or two metrics, the authors' method is reported as the best in most cases. This highlights how selective metric reporting can create a misleading impression of superiority [44].
Frequently Asked Questions (FAQs) on Bias Avoidance
Q1: What exactly is the "self-assessment trap" in computational biology? The self-assessment trap occurs when method developers are put in the position of judge and jury for their own creations. This creates a conflict of interest, both conscious and unconscious, that often leads to an overestimation of the method's performance. Studies show it is exceptionally rare for developers to publish findings where their new method is not top-ranked in at least one metric or dataset [44].
Q2: Why is using only simulated data for benchmarking considered a limitation? While simulated data has the advantage of a known "ground truth," it cannot capture the full complexity and experimental variability of real biological systems. Models used for simulation can differentially bias algorithm outcomes, and methods trained or tested solely on simulated data may fail when applied to real-world data [27]. A robust benchmark should complement simulated data with experimental data [27].
Q3: What is "information leak" and how can I avoid it in my evaluation? Information leak occurs when data intended for testing is used during the method development or training phase, leading to overly optimistic performance estimates. This can happen subtly, for instance, if a very similar sample is present in both training and test sets. To avoid it, ensure a strict separation between training and test datasets and use proper, repeated cross-validation techniques without improper data reuse [44].
Q4: My new method isn't the "best" in a benchmark. Does it still have value? Absolutely. A method that is not top-ranked can still provide significant scientific value. It might uncover complementary biological insights, offer unique advantages like greater flexibility or speed, or contribute valuable results when aggregated with other methods. The scientific community should value and publish well-performing methods even if they are not the absolute best on a particular dataset [44].
Q5: What are the main types of bias in AI/ML models for biomedicine? Biases in AI/ML can be categorized into three main types [45]:
- Data Bias: Arises from unrepresentative or skewed training data.
- Development Bias: Stems from algorithmic choices, feature engineering, or practice variability.
- Interaction Bias: Emerges from the way the model interacts with its environment or users over time, including reporting bias and temporal changes in technology or clinical practice.
Troubleshooting Guides: Mitigating Common Biases
Guide 1: Mitigating the Self-Assessment Trap
Problem: A newly developed computational method is consistently evaluated as superior to all alternatives in internal assessments.
Solution:
- Implement Third-Party Validation: Submit your method to independent community challenges like DREAM, CASP, or CAMI, where predictions are evaluated against hidden data by impartial scorers [44] [27]. This tests the generalization ability of your method on unseen data.
- Use Multiple Performance Metrics: Avoid selective reporting by evaluating method performance across a comprehensive set of metrics (e.g., accuracy, precision, recall, scalability, usability). As shown in Table 1, using more than two metrics provides a more balanced and realistic view of performance [44].
- Adopt Neutral Benchmarking: Engage in or conduct "neutral" benchmarking studies where an independent group, with no perceived bias, compares all available methods. This provides the community with unbiased recommendations [3].
Guide 2: Correcting for Biases in Specific Data Types
Problem: CRISPR-Cas9 dropout screens are confounded by copy number (CN) and proximity biases, where genes in amplified genomic regions or located near each other show similar fitness effects regardless of their true biological function [46].
Solution: The appropriate computational correction method depends on your experimental setting and data availability. The following table summarizes recommendations from a recent benchmark of eight bias-correction methods [46].
Table 2: Selecting a Bias-Correction Method for CRISPR-Cas9 Screens
| Experimental Setting | Recommended Method | Key Rationale |
|---|---|---|
| Processing multiple screens with available Copy Number (CN) data | AC-Chronos | Outperforms others in correcting both CN and proximity biases when jointly processing multiple datasets with CN information [46]. |
| Processing an individual screen OR when CN information is unavailable | CRISPRcleanR | Top-performing method for individual screens; works in an unsupervised way without requiring additional CN data [46]. |
| General use, aiming for high-quality essential gene recapitulation | Chronos / AC-Chronos | Yields a final dataset that better recapitulates known sets of essential and non-essential genes [46]. |
Protocol: Benchmarking Bias-Correction Methods for CRISPR-Cas9 Data
- Data Acquisition: Obtain publicly available large-scale CRISPR-Cas9 screening data (e.g., from the Broad Institute's DepMap) and the corresponding CN variation profiles for the cell lines.
- Method Application: Run the raw screen data through the different correction methods (e.g., CRISPRcleanR, Chronos, AC-Chronos, MAGeCK).
- Bias Assessment:
- CN Bias: Calculate the correlation between corrected gene fitness scores and the CN of the gene's genomic location. A successful correction will show a reduced correlation.
- Proximity Bias: Calculate the median correlation of gene fitness scores for genes located on the same chromosome arm. A successful correction will show a reduced correlation [46].
- Performance Evaluation: Assess the ability of each corrected dataset to identify true positive essential genes (e.g., from the OGEE database) and preserve known cancer dependencies.
Experimental Protocols for Rigorous Benchmarking
Protocol 1: Designing a Neutral Benchmarking Study
This protocol outlines the essential steps for conducting a rigorous, unbiased comparison of computational methods, as detailed in the "Essential Guidelines for Computational Method Benchmarking" [3].
1. Define Purpose and Scope:
- Clearly state the goal of the benchmark (e.g., "to recommend the best method for single-cell RNA-seq clustering").
- Declare whether the study is "neutral" (independent) or part of a new method development.
2. Select Methods Comprehensively and Fairly:
- For a neutral benchmark, aim to include all available methods that meet pre-defined, justifiable inclusion criteria (e.g., software availability, functionality).
- If involving method authors, do so for all methods to ensure each is evaluated under optimal conditions. Report any methods whose authors decline to participate [3].
3. Choose and Design Benchmark Datasets:
- Use a variety of datasets, both simulated and real.
- For simulated data: Ensure the simulations accurately reflect key properties of real data by comparing empirical summaries (e.g., dropout rates, dispersion-mean relationships) [3].
- For real data: Use datasets with a known "ground truth" where possible. This can be achieved through experimental designs like spiking synthetic RNA molecules, fluorescence-activated cell sorting (FACS) of known cell populations, or using curated gold-standard databases like GENCODE [3] [27].
4. Execute Benchmark and Analyze Results:
- Run all methods in a standardized computing environment (e.g., using containerization with Docker/Singularity) to ensure consistency [47] [1].
- Evaluate methods using multiple, pre-registered performance metrics.
- Report results for all methods, not just the top performers. Use rankings and visualization to highlight different strengths and trade-offs among the methods [3].
Protocol 2: A Framework for Identifying and Quantifying Data Bias
This protocol is based on a method that identifies bias in labeled biomedical datasets by leveraging a typically representative unlabeled dataset [48].
1. Data Preparation:
- Assume you have a potentially biased labeled dataset and a larger, representative unlabeled dataset.
- Format the data for a binary classification task.
2. Model Fitting:
- Model the class-conditional distributions as being generated from a nested mixture of multivariate Gaussian distributions.
- Use a multi-sample expectation-maximization (MS-EM) algorithm to learn all individual and shared parameters of the model from the combined labeled and unlabeled data [48].
3. Bias Testing and Estimation:
- Test for Bias: Develop a statistical test using the learned model parameters to check for the presence of a general form of bias in the labeled data.
- Quantify Bias: If bias is detected, estimate its level by computing the distance between the corresponding class-conditional distributions in the labeled and unlabeled data [48].
Visual Workflows for Bias-Aware Research
Diagram 1: Benchmarking Study Design Workflow
The Scientist's Toolkit: Essential Research Reagents & Solutions
Table 3: Key Resources for Unbiased Computational Research
| Resource Name / Category | Type | Primary Function | Relevant Use Case |
|---|---|---|---|
| DREAM Challenges | Community Platform | Organizes impartial, community-wide benchmarks with hidden ground truth data. | Third-party validation to escape the self-assessment trap [44]. |
| GENCODE / UniProt-GOA | Curated Database | Provides highly accurate, manually annotated gene features and functional annotations. | Serves as a gold standard reference for benchmarking gene-related tools [27]. |
| Phred-PHRAP-CONSED | Software Pipeline | Performs base-calling, sequence assembly, and assembly editing for genomic data. | Foundational tool for generating accurate reference sequences [49]. |
| Containerization (Docker/Singularity) | Computational Tool | Packages software and dependencies into a standardized, reproducible unit. | Ensures consistent execution environments for benchmarking studies [47] [1]. |
| CRISPRcleanR | Computational Method | Corrects for copy number and proximity biases in CRISPR-Cas9 screening data in an unsupervised manner. | Mitigating data-specific biases in functional genomics screens [46]. |
| MS-EM Algorithm for Bias Testing | Computational Method | Identifies and quantifies the level of bias in labeled biomedical datasets. | Diagnosing data bias in machine learning projects [48]. |
Frequently Asked Questions (FAQs)
General Container Information
Why the name "Singularity"? The name "Singularity" draws from two concepts. First, it references the astrophysics phenomenon where a single point contains massive quantities of the universe. Second, it stems from the "Linux Bootable Business Card" project, which used a compressed single image file system called the "singularity." The name is not related to predictions about artificial intelligence surpassing human intelligence [50].
What makes Singularity special for computational environments? Singularity differs from other container solutions through several key design goals: reproducible and easily verifiable software stacks using checksummed or cryptographically signed container images; mobility of compute that works with standard data transfer tools; compatibility with complicated HPC and legacy architectures; and a security model designed for untrusted users running untrusted containers [50].
Do I need administrator privileges to use Singularity? You generally do not need admin privileges to run Singularity containers. However, you do need root access to install Singularity and for some container build functions, such as building from a recipe or creating writable images. This means you can run, shell, and import containers without special privileges once Singularity is installed [50].
Can multiple applications be packaged into one Singularity Container?
Yes, you can package entire pipelines and workflows with multiple applications, binaries, and scripts. Singularity allows you to define what happens when a container is run through the %runscript section, and you can even define multiple entry points to your container using modular %apprun sections for different applications [50].
Technical Implementation
How are external file systems and paths handled?
Singularity automatically resolves directory mounts to maintain portability. By default, /tmp, /var/tmp, and /home are shared into the container, along with your current working directory. For custom mounts, use the -B or --bind argument. Note that the target directory must already exist within your container to serve as a mount point [50].
How does Singularity handle networking? As of version 2.4, Singularity supports the network namespace to a limited degree, primarily for isolation. The networking capabilities continue to evolve with later versions, but full feature support was still under development at the time of the 2.6 documentation [50].
Can I containerize my MPI application with Singularity?
Yes, Singularity supports MPI applications effectively on HPC systems. The recommended usage model calls mpirun from outside the container, referencing the container within the command. This approach avoids complications with process spawning across nodes and maintains compatibility with the host system's high-performance fabric [50].
Can you edit/modify a Singularity container once created?
This depends on the image format. Squashfs containers are immutable to ensure reproducibility. However, if you build with --sandbox or --writable, you can create writable sandbox folders or ext3 images for development and testing. Once changes are complete, you can convert these back to standard, immutable images for production use [50].
Troubleshooting Guides
Environment and Configuration Issues
Issue: Unable to reproduce computational results or environment inconsistencies
- Problem: Software behaves differently across systems, or you cannot replicate published results due to environment variations.
- Solution:
- Verify Container Image Integrity: Use Singularity's built-in verification capabilities. Ensure you're using the exact same checksummed or cryptographically signed container image used in the original experiment [50].
- Standardize Build Recipes: Store and version-control your Singularity definition files (recipes) to ensure consistent builds. A continuous benchmarking ecosystem relies on formally defined benchmarks and reproducible software environments [1].
- Reproducible Software Stacks: Utilize Singularity's primary design goal of reproducible software stacks, which must be easily verifiable via checksum or cryptographic signature without changing formats [50].
Issue: File system paths not working correctly inside container
- Problem: Applications inside the container cannot find expected files or paths, or host system directories are not accessible.
- Solution:
- Understand Default Mounts: Singularity automatically binds
/home,/tmp,/var/tmp, and your current working directory into the container [50]. - Check Mount Point Existence: A directory must already exist inside your container to serve as a mount point. Singularity will not create it automatically [50].
- Use Custom Bind Mounts: For specific directories, use the
-Bor--bindcommand-line argument:singularity run --bind /host/path:/container/path container.simg[50]. - Review Bound Paths: Use
singularity exec container.simg mountto see what directories are currently bound to the container.
- Understand Default Mounts: Singularity automatically binds
Performance and Scaling Problems
Issue: MPI application performance degradation in containers
- Problem: Containerized MPI applications run slower than expected or show communication bottlenecks.
- Solution:
- Call mpirun Externally: Follow Singularity's recommended model by calling
mpirunfrom outside the container:mpirun -np 20 singularity exec container.img /path/to/contained_mpi_prog[50]. - Ensure Host Library Compatibility: Verify that the container was built with MPI libraries that are ABI-compatible with the host system's MPI installation, particularly for the high-performance fabric [50].
- Minimize Namespace Isolation: Avoid unnecessary namespace isolation that might impact MPI communication performance between nodes [50].
- Call mpirun Externally: Follow Singularity's recommended model by calling
Issue: Container deployment takes too long or fails provisioning
- Problem: Containers stall during deployment or fail to start properly.
- Solution:
- Verify Health Probes: Check that liveness, readiness, and startup probes are correctly configured, especially their port numbers and timeout values. Incorrect health probes can prevent containers from being marked as ready [51].
- Adjust Probe Timing for Long Startup: If your application takes extended time to start (common in Java or complex bioinformatics tools), increase the
Initial delay secondsproperty for liveness and readiness probes to prevent premature termination [51]. - Review Logs: Check system and console logs for error messages during the startup process to identify specific failure points [51].
Access and Connectivity Errors
Issue: Cannot access containerized services or endpoints
- Problem: Services running in containers are not accessible via network, return connection errors, or respond with unexpected HTTP status codes.
- Solution:
- Check Ingress Configuration: Verify that ingress is enabled and properly configured for your container environment, including protocol settings (HTTP/TCP) and target port configuration [51].
- Confirm Target Port: Ensure the target port matches the port your application inside the container is actually listening on, which may differ from the port exposed in the container definition [51].
- Review Network Security Rules: Check if client IP addresses are being blocked by security rules or firewall configurations [51].
- Inspect Network Configuration: For custom DNS setups, ensure your DNS server can correctly resolve necessary domains and isn't blocking essential IP addresses like
168.63.129.16used by Azure recursive resolvers [51].
Issue: Cannot pull container images from registry
- Problem: Container deployment fails with image pull errors, often due to network or authentication issues.
- Solution:
- Verify Registry Accessibility: Ensure your environment's firewall isn't blocking access to the container registry. Test by running
docker run --rm <your_container_image>to confirm public accessibility [51]. - Check DNS Configuration: If using a custom DNS server instead of the default, verify it's configured correctly and can resolve the container registry domain [51].
- Review Authentication: For private registries, ensure proper credentials are configured in your environment [51].
- Verify Registry Accessibility: Ensure your environment's firewall isn't blocking access to the container registry. Test by running
Dealing with Intermittent and Non-Reproducible Issues
Issue: Intermittent bugs that cannot be consistently reproduced
- Problem: Bugs occur sporadically in production or benchmarking environments but cannot be reproduced during testing.
- Solution:
- Generate Detailed Logs: Implement comprehensive logging throughout your application, especially in exception handling code. Create methods to collect these logs from users or production systems [52].
- Verify Exact Steps and Environment: Walk through the problem with the reporting party to ensure no steps are missed. Reproduce the environment as closely as possible, including OS versions, software versions, and concurrent applications [52].
- Conduct Code Review: Perform detailed code reviews on suspected faulty code with the aim of fixing theoretical bugs, even without definitive reproduction [52].
- Add Monitoring: Implement additional monitoring and logging specifically designed to capture the intermittent issue if it reoccurs [52].
- Consider Concurrency Issues: For random failures, consider concurrency issues. Use stress testing with high volumes of transactions to compress time and increase reproduction likelihood [52].
Key Research Reagent Solutions
Table: Essential Materials for Computational Benchmarking
| Item | Function |
|---|---|
| Singularity Containers | Provides reproducible software environments that can be easily verified, transferred, and run across different HPC systems [50]. |
| Benchmark Definition Files | Formal specifications (typically configuration files) that define the scope, components, software environments, and parameters for benchmarking studies [1]. |
| MPI Integration | Enables high-performance parallel computing within containers while maintaining compatibility with host system's high-performance fabric [50]. |
| Community Benchmarking Suites | Standardized toolkits (e.g., CZ Benchmarks) that provide predefined tasks, metrics, and datasets for neutral method comparison in specific domains like biology [4]. |
| Versioned Datasets | Reference datasets with precise versioning that serve as ground truth for benchmarking computational methods [1]. |
| Workflow Orchestration Systems | Automated systems that execute benchmarking workflows consistently, managing software environments and component dependencies [1]. |
| Health and Monitoring Probes | Configuration tools that verify container responsiveness and proper application startup, essential for reliable deployment in benchmarking pipelines [51]. |
Experimental Protocols and Workflows
Protocol 1: Establishing a Reproducible Benchmarking Environment
Objective: Create a standardized, verifiable environment for benchmarking computational biology tools using Singularity containers.
Methodology:
- Container Image Creation: Build Singularity images from definition files that specify the base OS, software dependencies, and application code.
- Verification Setup: Implement checksum verification or cryptographic signing of container images to ensure integrity.
- Environment Isolation: Configure containers to maintain reproducibility while allowing necessary access to host file systems using bind mounts.
- Benchmark Definition: Create formal benchmark specification files that define components, software versions, parameters, and evaluation metrics.
- Execution: Run benchmarks through workflow systems that interface with the containerized environments, capturing all outputs for analysis.
Reproducible Benchmarking Workflow
Protocol 2: Troubleshooting Non-Reproducible Computational Results
Objective: Systematically identify and resolve issues causing inconsistent computational results across environments.
Methodology:
- Environment Verification: Compare all software versions, library dependencies, and system configurations between working and non-working environments.
- Container Integrity Check: Validate container image checksums and verify that the exact same image is used across all tests.
- File System Audit: Check bind mount configurations and path mappings to ensure consistent file access between host and container environments.
- Resource Assessment: Monitor and compare computational resources (CPU, memory, storage) across environments to identify potential bottlenecks.
- Step-by-Step Logging: Implement detailed logging at each stage of the computational pipeline to isolate where results begin to diverge.
- Provenance Tracking: Capture complete execution provenance including all parameters, data versions, and environment variables.
Troubleshooting Inconsistent Results
Benchmarking Metrics and Performance Data
Table: Quantitative Assessment of Containerized Environments
| Metric Category | Measurement Approach | Expected Outcome | Acceptable Threshold |
|---|---|---|---|
| Reproducibility Rate | Percentage of repeated experiments yielding identical results | >95% consistency across environments | ≥90% for benchmark acceptance |
| Environment Setup Time | Time required to establish working computational environment | Significant reduction vs. manual setup | <30 minutes for standard benchmarks |
| Performance Overhead | Runtime comparison: containerized vs. native applications | Minimal performance impact | ≤5% performance regression |
| MPI Communication Efficiency | Inter-node communication bandwidth in containerized MPI jobs | Equivalent to native performance | ≥90% of native performance |
| Image Transfer Efficiency | Time to transfer container images across systems | Compatible with standard data mobility tools | Works with rsync, scp, http |
| Cross-Platform Consistency | Result consistency across different HPC architectures | Equivalent results across systems | 100% consistency required |
These metrics align with the principles of continuous benchmarking ecosystems, which emphasize the need for trustworthy, reproducible benchmarks to evaluate model performance accurately [1] [4]. Proper implementation ensures that researchers can spend less time on environment setup and debugging, and more time on scientific discovery [4].
Troubleshooting Guide: Common Optimization Issues in Computational Biology
Issue 1: Optimization Algorithm Converges to a Poor Local Solution
- Problem Description: Your parameter estimation algorithm consistently converges to a solution that provides a suboptimal fit to the experimental data, likely a local minimum of a complex, non-convex objective function [53] [54].
- Diagnosis Steps:
- Visualize the Cost Landscape: If possible with a subset of parameters, plot the objective function. A "bumpy" or multimodal landscape indicates a high risk of getting stuck in local minima [53] [54].
- Check for Reproducibility: Run the optimization multiple times from different initial parameter guesses. If you get different final parameter values with similar objective function values, your problem is likely multimodal [53].
- Resolution Methods:
- Employ Global Optimization: Switch from local search methods (e.g., basic gradient descent) to global optimization algorithms. Suitable stochastic and heuristic methods include [53] [55]:
- Multi-start methods: Run a local optimizer from many starting points.
- Markov Chain Monte Carlo (MCMC): A stochastic technique useful for problems involving stochastic equations.
- Genetic Algorithms (GA): Heuristic, nature-inspired methods effective for a broad range of problems.
- Use Hybrid Methods: Combine a global method for broad exploration with a local method for fine-tuning to enhance efficiency [54].
- Employ Global Optimization: Switch from local search methods (e.g., basic gradient descent) to global optimization algorithms. Suitable stochastic and heuristic methods include [53] [55]:
- Prevention Best Practices:
- Always perform multiple runs of your optimizer with random initializations.
- Incorporate prior knowledge about plausible parameter ranges to constrain the search space (e.g.,
lbandubin Equation (2)) [53].
Issue 2: Model Parameters Are Not Identifiable
- Problem Description: You find that different combinations of parameters yield equally good fits to your data, making it impossible to determine a unique, reliable set of parameter values [56].
- Diagnosis Steps:
- Conduct Structural Identifiability Analysis: Before parameter estimation, analyze the model structure to determine if parameters can, in principle, be uniquely estimated from the ideal (noise-free) data [56].
- Conduct Practical Identifiability Analysis: After estimation, analyze how uncertainties in the experimental data propagate to uncertainties in the parameter estimates. Wide confidence intervals indicate poor practical identifiability [56].
- Resolution Methods:
- Reformulate the Model: Simplify the model by fixing non-identifiable parameters to literature values or by combining correlated parameters.
- Design Better Experiments: Use optimal experimental design principles to design experiments that maximize the information content for parameter estimation [54].
- Use Regularization: Introduce penalties in the objective function to favor parameter values that are biologically plausible.
- Prevention Best Practices:
- Perform identifiability analysis early in the model development cycle.
- Ensure your experimental data is informative enough for the number of parameters you wish to estimate.
Issue 3: High Computational Cost of Optimization Runs
- Problem Description: A single evaluation of your model is slow (e.g., simulating large ODE systems), making the optimization process computationally prohibitive.
- Diagnosis Steps:
- Profile Your Code: Identify the specific components of your model simulation that are the most time-consuming.
- Check Algorithm Choice: Using a method that requires a very high number of function evaluations (like some naive implementations of Genetic Algorithms) on a slow model will be infeasible [53].
- Resolution Methods:
- Model Reduction: Simplify your mechanistic model to reduce simulation time.
- Surrogate Modeling: Replace the expensive mechanistic model with a faster, approximate surrogate model (e.g., a Gaussian process or a neural network) for the optimization phase [56].
- Leverage Parallelization: Choose optimization algorithms that can evaluate multiple candidate solutions in parallel (e.g., the population evaluation in Genetic Algorithms) [53].
- Prevention Best Practices:
- Start optimization tests on a small, simplified version of your model or dataset.
- Utilize high-performance computing (HPC) or cloud computing resources from the start for scalable workflows [17].
Issue 4: Poor Performance on Held-Out or New Data After Tuning
- Problem Description: Your model, with its finely-tuned parameters, performs excellently on the training data but generalizes poorly to new validation data or real-world tasks.
- Diagnosis Steps:
- Resolution Methods:
- Use Robust Benchmarking Suites: Rely on community-vetted, continuous benchmarking ecosystems that provide diverse tasks and datasets to prevent overfitting to a single benchmark [47] [1] [4].
- Implement Cross-Validation: Tune parameters using cross-validation on the training data instead of a single train-test split.
- Re-evaluate Metrics: Ensure the metrics used for tuning during benchmarking are aligned with the ultimate biological application [4].
- Prevention Best Practices:
- "Avoid over-optimizing for benchmark success rather than biological relevance" [4].
- Use held-out test datasets that are not used during the parameter tuning process.
Frequently Asked Questions (FAQs)
What is the difference between local and global optimization, and why does it matter in systems biology?
Local optimization aims to find the best solution within a small, local region of the search space. In contrast, global optimization seeks the absolute best solution across the entire feasible parameter space [53]. This is critical in systems biology because the objective functions (e.g., for parameter estimation) are often non-convex and multimodal, meaning they possess multiple local minima. A local optimizer can easily get trapped in one of these, yielding a suboptimal model fit. Global methods are designed to overcome this by more extensively exploring the parameter space [53] [54] [55].
How do I choose the right optimization algorithm for my parameter estimation problem?
The choice depends on the properties of your problem and model. The table below summarizes key characteristics of three common algorithm classes [53]:
| Algorithm Type | Key Characteristics | Ideal Problem Type | Parameter Support |
|---|---|---|---|
| Multi-start Least Squares | Deterministic; fast convergence to a local minimum; proven convergence under specific hypotheses [53]. | Fitting continuous parameters to experimental data; model tuning [53]. | Continuous [53] |
| Markov Chain Monte Carlo (MCMC) | Stochastic; samples the parameter space; can find global solutions; handles stochastic models [53]. | Problems with stochastic equations or simulations; Bayesian inference [53]. | Continuous, Non-continuous objective functions [53] |
| Genetic Algorithms (GA) | Heuristic; population-based; inspired by natural selection; robust for complex landscapes [53]. | Broad-range applications, including model tuning and biomarker identification; mixed-parameter problems [53]. | Continuous & Discrete [53] |
What is parameter identifiability, and how can I assess it?
Parameter identifiability is a concept that determines whether the parameters of a model can be uniquely estimated from the available data [56]. It is split into two types:
- Structural Identifiability: An analysis of the model structure itself, performed before parameter estimation, to determine if parameters could be uniquely identified from perfect, noise-free data [56].
- Practical Identifiability: An analysis performed after parameter estimation to assess how the quality and noise in the actual experimental data affect the uncertainty of the parameter estimates. This often involves calculating confidence intervals [56].
What are Hybrid Neural ODEs, and how do they help with parameter estimation?
Hybrid Neural ODEs (HNODEs) combine mechanistic knowledge (expressed as Ordinary Differential Equations) with data-driven neural networks [56]. They are formulated as:
dy/dt = f_M(y, t, θ_M) + NN(y, t, θ_NN)
where f_M is the known mechanistic part, NN is a neural network, θ_M are the mechanistic parameters, and θ_NN are the network parameters [56]. They are useful when you have incomplete mechanistic knowledge. The neural network acts as a universal approximator to learn the unknown parts of the system dynamics, allowing for more accurate parameter estimation of the known mechanistic components (θ_M) even with an imperfect model [56].
Why is benchmarking important for parameter tuning and optimization?
Benchmarking provides a neutral, standardized framework to evaluate the performance of computational methods, including those for optimization and parameter tuning [1] [4].
- For Method Developers: It allows fair comparison against the state-of-the-art, highlighting true improvements rather than artifacts of specific data or tuning [1].
- For Researchers/Users: It helps select the most suitable and robust method for their specific biological task and data type [1].
- For the Field: It prevents "cherry-picking" of results and overfitting to static benchmarks, ensuring that progress is measurable and reproducible [4]. Community-driven benchmarks are emerging as critical infrastructure for trustworthy evaluation [4].
The Scientist's Toolkit: Essential Reagents & Materials
The following table details key computational "reagents" and tools essential for optimization and benchmarking workflows in computational biology.
| Tool/Reagent | Function/Biological Application |
|---|---|
| Workflow Management Systems (e.g., Nextflow, Snakemake) | Orchestrate and automate complex bioinformatics pipelines, ensuring reproducibility, managing software environments, and providing error logging for troubleshooting [17]. |
| Global Optimization Software (e.g., AMIGO, DOTcvpSB) | Provide implemented algorithms (e.g., enhanced Scatter Search) for solving multimodal parameter estimation problems in dynamic models of biological systems [55]. |
| Hybrid Neural ODE (HNODE) Frameworks | Enable parameter estimation for models with partially known mechanisms by combining ODEs with neural networks to approximate unknown dynamics [56]. |
| Data Quality Control Tools (e.g., FastQC, MultiQC) | Perform initial quality checks on raw sequencing data to identify issues (e.g., low-quality reads, adapters) that could propagate and skew downstream analysis and optimization [17]. |
| Community Benchmarking Suites (e.g., CZ Benchmarks) | Provide standardized tasks, datasets, and metrics for evaluating model performance in a neutral, comparable manner, accelerating robust method development [4]. |
| Version Control Systems (e.g., Git) | Track changes to code, models, and parameters, ensuring full reproducibility of all optimization and analysis steps [17]. |
Experimental Protocols & Workflows
Detailed Methodology: Parameter Estimation Workflow with Identifiability Analysis
This protocol outlines a robust pipeline for estimating parameters and assessing their identifiability, particularly when using hybrid modeling approaches [56].
1. Workflow Diagram
2. Step-by-Step Protocol
- Inputs: An incomplete mechanistic model (e.g., a system of ODEs with unknown parameters,
θ_M) and a time-series dataset of experimental observations [56]. - Step 1: Data Preparation. Partition the experimental observation time points into training and validation sets [56].
- Step 2: Model Embedding and Training.
- Step 2a: Hyperparameter Tuning. Embed the incomplete mechanistic model into a HNODE framework. Use a global search method like Bayesian Optimization to simultaneously tune the model's hyperparameters (e.g., learning rates, network architecture) and explore the mechanistic parameter search space [56].
- Step 2b: Full Training. Using the best hyperparameters, fully train the HNODE model (often using gradient-based methods) to obtain point estimates for the mechanistic parameters,
θ_M[56].
- Step 3: Identifiability Analysis. Conduct a posteriori (practical) identifiability analysis. This involves evaluating the sensitivity of the cost function to changes in the parameter estimates around the optimized values. Parameters for which the cost function changes significantly are considered "identifiable" [56].
- Step 4: Confidence Interval Estimation. For parameters deemed identifiable in Step 3, calculate asymptotic confidence intervals (CIs) to quantify the uncertainty in their estimated values [56].
- Output: A set of estimated mechanistic parameters,
θ_M, with identifiability status and associated confidence intervals where applicable [56].
Conceptual Diagram: The Benchmarking Ecosystem
This diagram illustrates the multi-layered structure of a continuous benchmarking ecosystem, highlighting the components and challenges involved in creating and maintaining benchmarks for computational biology tools [1].
Frequently Asked Questions (FAQs)
What are the first steps when my analysis is running too slowly?
Your first step should be to identify the specific bottleneck. Is the problem due to computation, memory, disk storage, or network transfer? Use code profiling tools to pinpoint the exact sections of code consuming the most time or resources. For R users, the Rprof profiler or the aprof package can visually identify these bottlenecks, ensuring your optimization efforts are targeted effectively [58].
How can I make my code run faster without learning a new programming language? Significant speed gains can often be achieved within your current programming environment by applying a few key techniques [58]:
- Avoid growing data objects in loops; instead, pre-allocate all required memory.
- Use vectorized operations wherever possible, as these execute pre-compiled, efficient lower-level code.
- Eliminate non-essential operations inside loops, such as printing statements or redundant calculations.
- Practice memoization: store results of expensive function calls rather than recalculating them repeatedly.
My workflow needs more power than my laptop can provide. What are my options? For computationally intensive tasks, consider moving your workflow to a High-Performance Computing (HPC) cluster. These clusters use workload managers, like Slurm, to efficiently distribute jobs across many powerful computers (nodes) [59]. Alternatively, cloud computing platforms (e.g., Galaxy) provide on-demand access to scalable computational resources and a plethora of pre-configured tools, abstracting away infrastructure management [60].
How can I manage and store large datasets (e.g., genomic data) efficiently? Centralizing data and bringing computation to it is an efficient strategy [61]. For projects generating terabyte- or petabyte-scale data, consider:
- Centralized Storage: House large datasets on a central storage system or data lake to avoid moving data over slow networks.
- Computational Storage: For some applications, emerging Computational Storage Devices (CSDs) that process data where it resides can minimize data transfer overhead [62].
- Data Organization: Properly organize and format large-scale data (e.g., using efficient binary formats instead of plain text) to facilitate faster access and analysis [61].
Why is standardized benchmarking important, and how can I do it robustly? Standardized, neutral benchmarking is crucial for fairly evaluating computational methods and providing the community with trustworthy performance comparisons [3]. To ensure robustness [63] [3]:
- Define the scope and purpose clearly from the start.
- Use a diverse set of reference datasets, including both simulated data (with known ground truth) and real experimental data.
- Evaluate performance with multiple metrics to capture different strengths and trade-offs.
- Use a formal workflow system (e.g., Nextflow, Snakemake) and containerized software environments to ensure reproducibility and transparency [1] [63].
Troubleshooting Guides
Guide 1: Diagnosing and Solving Common Computational Bottlenecks
This guide helps you diagnose the nature of your resource constraint and apply targeted solutions. The following diagram outlines the logical process for diagnosing common performance bottlenecks.
Once you have identified the bottleneck, refer to the table below for specific mitigation strategies.
Table 1: Common Computational Bottlenecks and Mitigation Strategies
| Bottleneck Type | Key Signs | Solution Strategies |
|---|---|---|
| Computationally Bound [61] | Algorithm is complex and requires intense calculation (e.g., NP-hard problems like Bayesian network reconstruction). Long runtimes with high CPU usage. | Parallelize the algorithm across multiple cores or nodes (HPC/Cloud) [58] [59]. Use optimized, lower-level libraries. For some problems, leverage GPU acceleration [60]. |
| Memory Bound [61] | The dataset is too large for the computer's RAM, leading to slowdowns from swapping to disk. | Process data in smaller chunks. Use more efficient data structures (e.g., matrices instead of data.frames in R for numeric data) [58]. Increase memory allocation via HPC job requests [59]. |
| Disk I/O Bound [61] | Frequent reading/writing of large files; slow storage media; working directory on a network drive. | Use faster local solid-state drives (SSDs) for temporary files. Utilize efficient binary data formats (e.g., HDF5) instead of text. |
| Network Bound [61] | Slow transfer of large input/output datasets over the internet or network. | House data centrally and bring computation to the data (e.g., on an HPC cluster or cloud) [61]. For very large datasets, physical shipment of storage drives may be more efficient than internet transfer [61]. |
Guide 2: Optimizing Code for Efficiency
Before seeking more powerful hardware, optimize your code. This guide outlines a workflow for iterative code improvement, from profiling to implementation.
Apply the specific optimization techniques listed in the table below to the bottlenecks you identified.
Table 2: Common Code Optimization Techniques with Examples
| Technique | Description | Practical Example |
|---|---|---|
| Pre-allocation [58] | Allocate memory for results (e.g., an empty matrix/vector) before a loop, rather than repeatedly growing the object inside the loop. | In R, instead of results <- c(); for(i in 1:N){ results <- c(results, new_value)}, use results <- vector("numeric", N); for(i in 1:N){ results[i] <- new_value}. |
| Vectorization [58] | Replace loops that perform element-wise operations with a single operation on the entire vector or matrix. | In R, instead of for(i in 1:ncol(d)){ col_means[i] <- mean(d[,i]) }, use the vectorized col_means <- colMeans(d). |
| Memoization [58] | Store the result of an expensive function call and reuse it, rather than recalculating it multiple times. | Calculate a mean or transpose a matrix once before a loop and store it in a variable, instead of recalculating it inside every iteration of the loop. |
| Using Efficient Data Structures [58] | Choose data structures that are optimized for your specific task and data type. | In R, use a matrix instead of a data.frame for storing numerical data to reduce overhead. |
Guide 3: Leveraging High-Performance Computing (HPC) with Slurm
For tasks that exceed a single machine's capacity, HPC clusters managed by Slurm are essential. The following diagram illustrates the job submission workflow.
To use Slurm effectively, you must specify your job's resource requirements. The table below outlines key parameters.
Table 3: Essential Slurm Job Configuration Parameters
| Parameter | Function | Example Flag |
|---|---|---|
| Number of CPUs (Cores) | Requests the number of central processing units needed for parallel tasks. | --cpus-per-task=4 |
| Amount of Memory (RAM) | Specifies the memory required per node. | --mem=16G |
| Wall Time | Sets the maximum real-world time your job can run. | --time=02:30:00 (2 hours, 30 mins) |
| Number of Nodes | Defines how many distinct computers (nodes) your job should span. | --nodes=1 |
| Job Dependencies | Ensures jobs run in a specific order, e.g., Job B starts only after Job A finishes. | --dependency=afterok:12345 |
| Partition/Queue | Submits the job to a specific queue (partition) on the cluster, often for different job sizes or priorities. | --partition=gpu |
Table 4: Essential Software and Hardware Solutions for Computational Benchmarking
| Item | Category | Primary Function |
|---|---|---|
| R/Python Profilers (Rprof, aprof, cProfile) | Software Tool | Identifies specific lines of code that are computational bottlenecks, guiding optimization efforts [58]. |
| Slurm Workload Manager | Software Infrastructure | Manages and schedules computational jobs on HPC clusters, ensuring fair and efficient resource sharing among users [59]. |
| Workflow Management Systems (Nextflow, Snakemake) | Software Tool | Orchestrates complex, multi-step computational analyses in a reproducible and portable manner across different computing environments [1] [63]. |
| Container Platforms (Docker, Singularity) | Software Environment | Packages code, dependencies, and the operating system into a single, isolated, and reproducible unit, eliminating "works on my machine" problems [60]. |
| Community Benchmarking Suites (e.g., CZI cz-benchmarks) | Benchmarking Framework | Provides standardized, community-vetted tasks and datasets to fairly evaluate and compare the performance of computational methods, such as AI models in biology [4]. |
| HPC Cluster | Hardware Infrastructure | A collection of interconnected computers (nodes) that work together to provide massively parallel computational power for large-scale data analysis and simulation [59]. |
| Computational Storage Devices (CSDs) | Hardware Solution | Storage drives with integrated processing power, enabling data to be processed directly where it is stored, minimizing energy-intensive data movement [62]. |
Strategies for Scalable and Extensible Benchmarking Infrastructure
Frequently Asked Questions (FAQs)
Q1: What are the core components of a formal benchmark definition? A formal benchmark definition acts as a blueprint for your entire study. It should be expressible as a configuration file that specifies the scope and topology of all components, including: the specific code implementations and their versions, the instructions to create reproducible software environments (e.g., Docker or Singularity containers), the parameters used for each method, and which components to snapshot for a permanent record upon release [1] [63]. This formalization is key to ensuring the benchmark is FAIR (Findable, Accessible, Interoperable, and Reusable).
Q2: How can I ensure my benchmarking results are neutral and unbiased? Neutrality is critical, especially in independent benchmark-only papers (BOPs). To minimize bias, strive to be equally familiar with all methods being compared, or ideally, involve the original method authors to ensure each tool is evaluated under optimal conditions. Clearly report any methods whose authors declined to participate. Avoid the common pitfall of extensively tuning parameters for a favored method while using only default settings for others [64] [3]. Using blinding strategies, where the identity of methods is hidden during initial evaluation, can also help reduce bias [64].
Q3: What is the best way to select and manage datasets for benchmarking? A robust benchmark uses a variety of datasets to evaluate methods under different conditions. These generally fall into two categories, each with advantages:
- Simulated Data: Contains a known "ground truth," enabling precise quantitative performance metrics. It is crucial to validate that simulations accurately reflect relevant properties of real data to avoid overly simplistic or misleading scenarios [64] [3].
- Real Experimental Data: Better represents real-world complexity. However, a ground truth is often not available. In these cases, you may use a "gold standard" derived from highly accurate experimental procedures, manual expert curation, or consensus from multiple methods [27] [3].
Q4: Our team wants to build a continuous benchmarking system. What architectural principles should we follow? Building a scalable ecosystem involves several key principles:
- Decouple Environment Handling from Workflow Execution: Use technologies like containerization (Docker) and package managers (Conda) to manage software dependencies separately from the workflow logic itself. This enhances reproducibility and portability across different computing infrastructures [1] [63].
- Use Formal Workflow Systems: Orchestrate your benchmarks with systems like Nextflow, Snakemake, or the Common Workflow Language (CWL). This ensures that the entire process is automated, reproducible, and can track provenance [1] [63] [27].
- Design for Extensibility: Structure your benchmark so that new methods, datasets, or metrics can be added with minimal effort. A well-defined benchmark definition makes it easy for the community to contribute and extend the work [1] [4].
Q5: How should we handle performance metrics and result interpretation? Benchmarks, particularly in bioinformatics, are often evaluated by multiple metrics, and a single "winner" is not always meaningful. The strategy is to:
- Use Multiple Metrics: A single metric can give a narrow view. Using several (e.g., precision, recall, scalability) provides a more holistic performance picture [64] [4].
- Identify Top Performers: Use rankings to identify a group of high-performing methods rather than focusing on a single top-ranked method, as minor performance differences may not be significant [64] [3].
- Highlight Trade-offs: Different methods will have different strengths. Clearly communicate the trade-offs between them (e.g., a method that is highly accurate but computationally expensive vs. a faster, less precise one) to help users select the best tool for their specific needs [64].
Troubleshooting Common Experimental Issues
Issue 1: "A method fails to run due to missing software dependencies or version conflicts."
- Diagnosis: This is one of the most common challenges in computational benchmarking, often described as "dependency hell."
- Solution: Containerize all methods. Package each tool and its dependencies into a Docker or Singularity container. This isolates the software environment and guarantees that the method will run consistently, regardless of the underlying host system [27]. In a continuous benchmarking platform, these containers become a core component of the benchmark definition [1] [63].
Issue 2: "My workflow runs successfully but the results are inconsistent or unreliable."
- Diagnosis: The instability can stem from uncontrolled variability in the test environment, non-deterministic algorithms, or insufficient data.
- Solution:
- Ensure a Controlled Environment: Execute all benchmarks in an environment that closely mirrors production conditions, with identical hardware and system configurations where possible [65] [66].
- Run Repeated Tests: Conduct benchmark tests multiple times to account for inherent variability and gather reliable data for statistical analysis [65] [67].
- Verify Ground Truth: If using simulated data, re-check that the simulation model accurately reflects key properties of real data [64] [3].
Issue 3: "Interpreting the benchmark results is overwhelming; it's difficult to draw clear conclusions."
- Diagnosis: This often occurs when results are presented as large, complex tables without a clear framework for interpretation.
- Solution:
- Go Beyond Rankings: Instead of relying solely on method rankings, use visualizations like FunkyHeatmaps to show performance across multiple metrics and datasets simultaneously [63].
- Contextualize with Real-World Relevance: Interpret results in the context of the benchmark's original purpose. For a neutral benchmark, provide clear guidelines for method users. For a method-development paper, focus on what the new method offers compared to the state-of-the-art [64] [3].
- Use Interactive Dashboards: For a continuous benchmarking system, implement web-based dashboards that allow users to filter, sort, and explore results interactively based on the metrics and datasets most relevant to them [1] [4].
Issue 4: "The benchmark is difficult for others to reproduce or extend."
- Diagnosis: The benchmark lacks sufficient documentation, version control, or a modular design.
- Solution:
- Adopt Reproducible Research Practices: Publicly share all code, version it with Git, and use dependency management tools. Clearly document all steps from data preparation to result generation [64] [27].
- Snapshot Releases: When publishing benchmark results, create a permanent snapshot (e.g., a Git tag, a Zenodo deposit) of the entire codebase, data, and software environments used to produce them [1].
- Leverage Community Standards: Use common workflow languages (e.g., CWL) and data formats to lower the barrier for others to reuse and build upon your work [1] [63].
Experimental Protocols & Data Presentation
Key Quantitative Performance Metrics for Computational Tool Benchmarking
The table below summarizes essential metrics used to evaluate computational tools. The choice of metric should be guided by the specific task and the nature of the available ground truth.
| Metric Category | Specific Metrics | Description | Best Used For |
|---|---|---|---|
| Accuracy & Performance | Precision, Recall, F1-Score, Area Under the ROC Curve (AUC) | Measures the ability to correctly identify true positives while minimizing false positives and negatives. | Tasks with a well-defined ground truth, such as classification, differential expression analysis, or variant calling [64] [27]. |
| Scalability | CPU Time, Wall-clock Time, Peak Memory Usage | Measures computational resource consumption and how it changes with increasing data size or complexity. | Evaluating whether a method is practical for large-scale datasets (e.g., single-cell RNA-seq with millions of cells) [64] [3]. |
| Stability/Robustness | Result variance across multiple runs or subsampled data | Measures the consistency of a method's output when given slightly perturbed input or under different random seeds. | Assessing the reliability of a method's output [64]. |
| Usability | Installation success rate, Code documentation quality, Runtime error frequency | Qualitative measures of how easily a tool can be installed and run by an independent researcher. | Providing practical recommendations to the end-user community [64] [3]. |
Essential Research Reagent Solutions for Benchmarking
This table details key "reagents" or resources required to conduct a rigorous benchmarking study in computational biology.
| Resource Type | Item | Function in the Experiment |
|---|---|---|
| Data | Simulated Datasets (e.g., using Splatter, SymSim) | Provides a precise ground truth for validating a method's accuracy and testing its limits under controlled conditions [3]. |
| Data | Gold Standard Experimental Datasets (e.g., from GENCODE, GIAB, or with FACS-sorted cells) | Provides a trusted reference based on empirical evidence to validate method performance on real-world data [27] [3]. |
| Software & Environments | Containerization Platforms (Docker, Singularity) | Creates isolated, reproducible software environments for each method, solving dependency issues and ensuring consistent execution [27]. |
| Software & Environments | Workflow Management Systems (Nextflow, Snakemake, CWL) | Orchestrates the entire benchmarking process, automating the execution of methods on multiple datasets and ensuring provenance tracking [1] [63]. |
| Software & Environments | Benchmarking Toolkits (e.g., CZ Benchmarking Suite, Viash) | Provides pre-built, community-vetted tasks, metrics, and pipelines to accelerate the setup and execution of benchmarks [4]. |
| Computing | High-Performance Computing (HPC) or Cloud Infrastructure | Provides the scalable computational power needed to run multiple methods on large datasets in a parallel and efficient manner [1]. |
Benchmarking Infrastructure Workflows
Diagram: High-Level Benchmarking Workflow
Diagram: Conceptual Architecture of a Benchmarking Ecosystem
Beyond Rankings: Validating Performance and Deriving Meaningful Conclusions
Frequently Asked Questions (FAQs)
Mean Squared Error (MSE)
Q1: What does Mean Squared Error (MSE) measure in my computational model? MSE quantifies the average squared difference between the actual observed values and the values predicted by your model. It measures the accuracy of a regression model, with a lower MSE indicating a better fit of the model to your data. The squaring ensures all errors are positive and gives more weight to larger errors [68] [69].
Q2: How do I calculate MSE for a set of predictions? The formula for MSE is: MSE = (1/n) * Σ(actual – forecast)² [68] Follow these steps:
- Find the error for each data point:
(Actual value - Predicted value). - Square each of these errors.
- Sum all the squared errors.
- Divide the total by the number of data points (
n) [68].
Q3: My MSE value is high. What are the common troubleshooting steps? A high MSE suggests significant discrepancies between your model's predictions and the actual data. Key areas to investigate include:
- Model Underfitting: The model may be too simple to capture the underlying trends in your data. Consider using a more complex model or adding relevant features.
- Data Quality: Check for and handle outliers, as their large errors are heavily penalized by the squaring in MSE. Also, ensure your data is cleaned and normalized if necessary.
- Feature Selection: The current set of input variables (features) might not have a strong predictive relationship with the target output. Re-evaluate your feature selection process [69].
Correlation Coefficients
Q4: How do I interpret the strength of a Pearson's correlation coefficient (r)?
The value of r indicates the strength and direction of a linear relationship. Here is a consolidated guide from different scientific fields [70]:
| Correlation Coefficient (r) | Dancey & Reidy (Psychology) | Chan YH (Medicine) |
|---|---|---|
| ± 1.0 | Perfect | Perfect |
| ± 0.9 | Strong | Very Strong |
| ± 0.8 | Strong | Very Strong |
| ± 0.7 | Strong | Moderate |
| ± 0.6 | Moderate | Moderate |
| ± 0.5 | Moderate | Fair |
| ± 0.4 | Moderate | Fair |
| ± 0.3 | Weak | Fair |
| ± 0.2 | Weak | Poor |
| ± 0.1 | Weak | Poor |
| 0.0 | Zero | None |
Q5: A correlation in my data is statistically significant (p < 0.05), but the coefficient is weak (r = 0.15). How should I report this? You should report both the strength and the statistical significance. A statistically significant correlation means the observed relationship is unlikely to be due to random chance. However, a weak coefficient (e.g., r=0.15) indicates that while the relationship may be real, the effect size is small and one variable is not a strong predictor of the other. It is crucial to avoid overinterpreting the strength and to remember that correlation does not imply causation [70] [71].
Q6: What is the difference between Pearson's and Spearman's correlation?
- Pearson's r: Measures the strength and direction of a linear relationship between two continuous variables. It assumes the data are normally distributed [70] [71].
- Spearman's rho: A nonparametric measure that assesses monotonic relationships (whether the variables tend to change together, but not necessarily at a constant rate). It is based on the ranks of the data and should be used for ordinal data, non-normal distributions, or when your data contains outliers [70] [71].
Classification Accuracy
Q7: What is the problem with using simple "classification accuracy" for an imbalanced dataset? In an imbalanced dataset, one class has significantly more samples than the other(s). A model can achieve high accuracy by simply always predicting the majority class, while failing to identify the minority class. For example, a model in a dataset where 99% of samples are "normal" and 1% are "diseased" could be 99% accurate by never predicting "diseased," which is not useful [72].
Q8: What metrics should I use instead of accuracy for imbalanced classification? You should use a suite of metrics derived from the confusion matrix, which provides a detailed breakdown of true positives (TP), false positives (FP), true negatives (TN), and false negatives (FN) [73] [72].
- Precision: Of all the instances predicted as positive, how many are actually positive? (TP / (TP + FP))
- Recall (Sensitivity): Of all the actual positive instances, how many did the model correctly identify? (TP / (TP + FN))
- F1-Score: The harmonic mean of Precision and Recall, providing a single balanced metric [72].
Q9: What are sensitivity and specificity in the context of screening tools?
- Sensitivity (or Recall): The probability that a test correctly identifies individuals who are at risk or have a condition (True Positive Rate). In academic screening, it is the tool's ability to correctly classify a student as "at-risk" when they genuinely are [73].
- Specificity: The probability that a test correctly identifies individuals who are not at risk or do not have the condition (True Negative Rate). It is the tool's ability to correctly classify a student as "not-at-risk" when they genuinely are not [73]. The National Center on Intensive Interventions (NCII) recommends a sensitivity of ≥70% and a specificity of ≥80% for a screening tool to be considered accurate [73].
Troubleshooting Guides
Guide 1: Diagnosing and Improving High MSE in Regression Models
This guide helps you systematically address poor regression performance.
Workflow Description: The diagram outlines a logical path for troubleshooting a high MSE. The process begins by inspecting data quality for outliers that disproportionately inflate MSE. The next critical step is to diagnose whether the model is underfitting (too simple to capture data patterns) or overfitting (too complex, modeling noise). For underfitting, solutions include feature engineering or using a more complex model. For overfitting, apply regularization techniques to constrain the model [69] [72].
Guide 2: Selecting the Right Metric for Correlation Analysis
This guide helps you choose the appropriate correlation coefficient based on your data type and relationship.
Key Reagents for Correlation Analysis:
| Research Reagent | Function |
|---|---|
| Pearson's r | Measures the strength and direction of a linear relationship between two continuous, normally distributed variables [70] [71]. |
| Spearman's rho | Measures the strength and direction of a monotonic relationship; used for ordinal data, non-normal distributions, or ranked data [70] [71]. |
| Kendall's Tau | An alternative to Spearman's rho for measuring ordinal association; can be more accurate with small datasets with many tied ranks [70]. |
| Scatter Plot | A visual reagent used to graph the relationship between two continuous variables and check for linearity or monotonic trends before calculating a coefficient [71]. |
Workflow Description: This decision tree guides the selection of a correlation coefficient. The primary question is whether your data is continuous. If yes, assess if the relationship is linear and if the data is normally distributed; if both are true, use Pearson's r. If the relationship is not linear, or the data is not normal, use Spearman's rho. For ordinal or ranked data, Spearman's rho is also appropriate, with Kendall's Tau being a good alternative, especially with many tied ranks [70] [71].
Guide 3: Addressing Poor Performance in Classification Models
This guide focuses on moving beyond simple accuracy, especially with imbalanced datasets.
Key Reagents for Classification Analysis:
| Research Reagent | Function |
|---|---|
| Confusion Matrix | A table that lays out True Positives (TP), False Positives (FP), True Negatives (TN), and False Negatives (FN), forming the basis for all other advanced metrics [72]. |
| Precision | Measures the model's reliability when it predicts a positive class. Critical when the cost of FPs is high. |
| Recall (Sensitivity) | Measures the model's ability to detect all positive instances. Critical when the cost of FNs is high (e.g., disease screening) [73]. |
| F1-Score | Provides a single metric that balances the trade-off between Precision and Recall. |
| Resampling | A technique to address class imbalance by either upsampling the minority class or downsampling the majority class [72]. |
Workflow Description: The diagram shows how key classification metrics are derived from the confusion matrix. The Confusion Matrix is the fundamental building block. From its components, you can calculate Precision (which uses TP and FP) and Recall (which uses TP and FN). These two metrics are then combined to calculate the F1-Score, which is especially useful for getting a single performance indicator on imbalanced datasets [72].
The Critical Role of Gold Standard and Mock Community Data
Frequently Asked Questions
What is a "gold standard" in computational biology benchmarking? A gold standard dataset serves as a ground truth in a benchmarking study. It is obtained through highly accurate, though often cost-prohibitive, experimental procedures (like Sanger sequencing) or is a synthetically constructed community with a known composition. The results from computational tools are compared against this standard to quantitatively assess their performance and accuracy [25].
Why are mock microbial communities considered a gold standard for microbiome studies? Mock microbial communities are synthetic mixes of known microbial species with defined, accurate abundance percentages. They provide a known truth against which bioinformatics pipelines can be tested. By including species with diverse characteristics (such as varying cell wall toughness and GC content), they help identify biases introduced during the entire workflow, from DNA extraction to bioinformatic analysis [74] [75] [76].
My mock community results show unexpected taxa. What does this mean? The presence of unexpected taxa, especially in low-biomass samples, often indicates contamination. It is crucial to include negative controls (e.g., DNA extraction and sequencing controls) in your experiment. If the composition of your low-biomass sample overlaps with that of the negative controls, the signal may not be biological but rather a result of contamination introduced during the workflow [74].
How can I objectively quantify the accuracy of my pipeline using a mock community? You can use the Measurement Integrity Quotient (MIQ) score, a standardized metric that quantifies bias. The MIQ score is calculated based on the root mean square error (RMSE) of observed species abundances that fall outside the expected manufacturing tolerance of the mock community. It provides a simple 0-100 score, where a higher score indicates better accuracy [76].
What is the key difference between simulated data and a mock community for benchmarking?
- Simulated Data: Computer-generated data with a known ground truth introduced algorithmically. Its main advantage is the ease of introducing a controlled true signal, but it may not capture the full complexity and variability of real biological data [25] [3].
- Mock Community: A laboratory-created mixture of real microbial cells or DNA with a known composition. It captures the technical noise and biases of real experimental workflows but can be more resource-intensive to create [75].
What are the best practices for selecting methods in a neutral benchmarking study? A neutral benchmark should strive to be as comprehensive as possible. It should include all available methods for a specific analytical task, or at a minimum, define clear, unbiased inclusion criteria (e.g., freely available software, ability to install and run successfully). The exclusion of any widely used methods should be clearly justified [3] [26].
Troubleshooting Guides
Issue: Inconsistent Microbiome Profiling Results Across Pipelines
Problem Different bioinformatic pipelines (e.g., bioBakery, JAMS, WGSA2, Woltka) yield different taxonomic profiles when analyzing the same shotgun metagenomic data, making it difficult to determine the true biological signal.
Solution
- Benchmark with a Mock Community: Start by processing a sequenced mock community (e.g., ZymoBIOMICS Microbial Community Standard) with your candidate pipelines [77] [76].
- Calculate Accuracy Metrics: Assess the output of each pipeline against the known composition of the mock community. Key metrics to calculate include [77]:
- Sensitivity: The proportion of expected species that were correctly detected.
- False Positive Relative Abundance: The total abundance assigned to species not present in the community.
- Aitchison Distance: A compositionally-aware distance metric that measures how far the result is from the expected composition.
- Compare and Select: Use the calculated metrics to objectively compare pipelines. For instance, a benchmarking study found that bioBakery4 performed well across multiple accuracy metrics, while JAMS and WGSA2 had the highest sensitivities [77].
Issue: Handling Low-Biomass Samples and Contamination
Problem When analyzing samples with low bacterial biomass (e.g., urine, tumor biopsies), the microbiota composition profiles are indistinguishable from or show significant overlap with negative controls.
Solution
- Incorporate Robust Controls: It is essential to include multiple negative controls (e.g., DNA extraction controls, sequencing controls) in your study design [74].
- Evaluate DNA Extraction Methods: Test different DNA extraction methods. Some methods may introduce more contamination than others, which is reflected by higher DNA concentrations in negative controls. Choose a method that minimizes this while maintaining efficiency for your sample type [74].
- Compare Profiles: Graphically compare the compositional profiles of your low-biomass samples with the negative controls. If they cluster together or show significant overlap, the signal from your sample is likely not reliable and should be interpreted with extreme caution [74].
Issue: Quantifying Bias in Your Microbiome Workflow
Problem You want a simple, standardized way to measure and report the technical bias introduced by your entire microbiome workflow, from sample collection to sequencing and analysis.
Solution
- Run a Mock Standard: Include a mock microbial community standard (e.g., ZymoBIOMICS) with every nucleic acid extraction batch as a positive control [76].
- Generate the MIQ Report:
- Obtain the expected relative abundance values for your mock community.
- Run your sequenced data through the freely available MIQ Score application (available for both 16S and shotgun data) [76].
- Interpret the Score: The application will generate a user-friendly report with a score from 0-100.
- >90: Excellent
- 80-89: Good
- 70-79: Moderate
- <70: Poor A low score indicates significant bias in your workflow that needs investigation [76].
Benchmarking Data & Experimental Protocols
Table 1: Characteristics of Benchmarking Data Types
| Data Type | Description | Key Advantages | Key Limitations | Ideal Use Case |
|---|---|---|---|---|
| Experimental Mock Community [74] [75] [76] | Lab-created mix of known microbes with defined abundances. | Captures real-world technical biases; provides a physical ground truth. | Can be expensive; may not cover all diversity of real samples. | Validating entire wet-lab and computational workflows; quantifying bias. |
| Simulated Data [25] [3] | Computer-generated data with a programmed ground truth. | Infinite, customizable data; perfect knowledge of the truth. | May not reflect full complexity of real data; models can introduce bias. | Testing algorithmic performance under controlled conditions; scalability tests. |
| Gold Standard Experimental Data [25] [3] | Data generated via highly accurate, reference methods (e.g., Sanger sequencing). | Considered a high-accuracy reference for real biological samples. | Often very costly to produce; may not be available for all research questions. | Serving as a reference for evaluating methods on real data where the truth is unknown. |
Table 2: Common Pitfalls in Benchmarking and Mitigation Strategies
| Pitfall | Consequence | Mitigation Strategy |
|---|---|---|
| Lack of Neutrality [3] [26] | Results are biased towards a specific tool, often one developed by the authors. | Prefer independent ("neutral") benchmarking studies. If developing a new method, compare against a representative set of state-of-the-art tools without excessive parameter tuning for your own tool. |
| Using Overly Simplistic Simulations [3] | Overly optimistic performance estimates that do not translate to real data. | Validate that simulated data recapitulates key properties of real data (e.g., error profiles, dispersion-mean relationships). |
| Ignoring Parameter Optimization [25] | Unfair comparison if one tool is highly tuned and others are run with defaults. | Document all parameters and software versions used. Ideally, use the same parameter optimization strategy for all tools or involve method authors. |
| Omitting Key Methods [3] [26] | Results are incomplete and not representative of the field. | Conduct a comprehensive literature search to identify all available methods. Justify the exclusion of any popular tools. |
Protocol: Benchmarking Bioinformatics Pipelines with a Mock Community
Objective: To objectively evaluate the accuracy of different bioinformatics pipelines in quantifying taxonomic abundance from sequencing data.
Materials:
- Sequencing Data: Raw sequencing reads (16S or shotgun) from a mock microbial community standard (e.g., ZymoBIOMICS, ATCC MSA2002) [74] [77].
- Bioinformatics Pipelines: The software tools to be evaluated (e.g., for shotgun metagenomics: bioBakery, JAMS, WGSA2, Woltka) [77].
- Ground Truth Table: A file containing the known, expected relative abundances of each species in the mock community.
- Computational Resources: A high-performance computing cluster or server with adequate memory and processing power.
Methodology:
- Data Preparation: Download or generate the sequencing data for the mock community. Ensure the ground truth table is accurate.
- Pipeline Processing: Process the raw sequencing data through each bioinformatics pipeline using the same computational environment and, if possible, unified preprocessing steps (e.g., quality trimming) to ensure a fair comparison [75].
- Output Standardization: Convert the taxonomic abundance output of each pipeline into a universal format (e.g., a table with taxa in rows and samples in columns) to facilitate comparison. Using NCBI taxonomy identifiers (TAXIDs) can help resolve inconsistent taxonomic naming across databases [77].
- Performance Evaluation: Calculate a set of pre-defined accuracy metrics by comparing the pipeline output to the ground truth. Essential metrics include [77]:
- Sensitivity: (True Positives) / (True Positives + False Negatives)
- False Positive Relative Abundance: Sum of all abundances assigned to taxa not in the mock community.
- Aitchison Distance: A compositional distance measure.
- Bray-Curtis Dissimilarity: A non-compositional beta-diversity metric to compare overall profile similarity [74].
- Fold Error: For each taxon, the ratio of observed abundance to expected abundance [74].
- Data Visualization: Create plots to visually compare performance, such as bar plots showing expected vs. observed abundances for each pipeline, and principal coordinates plots using Aitchison or Bray-Curtis distances [74] [76].
The Scientist's Toolkit
Research Reagent Solutions
| Item | Function in Benchmarking |
|---|---|
| ZymoBIOMICS Microbial Community Standard [76] | A defined mix of 8 bacteria and 2 yeasts used to spike samples as a positive control to quantify bias from DNA extraction through bioinformatics. |
| ATCC MSA2002 Mock Community [74] | Another commercially available mock community used to validate and benchmark 16S rRNA gene amplicon sequencing protocols and bioinformatic pipelines. |
| Complex In-House Mock Communities [75] | Large, custom-made mock communities (e.g., 235 strains, 197 species) providing a highly complex ground truth for rigorous testing of OTU/ASV methods. |
| NCBI Taxonomy Identifiers (TAXIDs) [77] | A unified system for labelling bacterial names with unique identifiers to resolve inconsistencies in taxonomic nomenclature across different bioinformatics pipelines and reference databases. |
Benchmarking Workflow Diagram
Best Practices for Community Challenges and Collaborative Benchmarking
Frequently Asked Questions
Planning and Design
Q1: What are the first steps in designing a community benchmarking challenge? The first steps involve clearly defining the challenge's purpose, scope, and the computational task to be evaluated. A formal benchmark definition should be established, specifying the components, datasets, evaluation metrics, and software environments [1] [63]. It is crucial to decide whether the challenge will be a neutral comparison or tied to new method development, as this affects the selection of methods and the perception of results [3].
Q2: How should we select datasets to ensure a fair and comprehensive evaluation? A robust benchmark should include a variety of datasets to evaluate methods under different conditions. The two primary categories are:
- Simulated Data: These datasets have a known ground truth, allowing for quantitative performance metrics. It is critical to validate that simulations accurately reflect the properties of real data [3].
- Real Experimental Data: While often more biologically relevant, they may lack a clear ground truth. Alternatives include using a gold standard derived from highly accurate experimental procedures, spike-in controls, or expert manual evaluation [3] [27].
Including multiple datasets from both categories provides a more complete picture of a method's performance [3].
Q3: What is the key to selecting appropriate evaluation metrics? Avoid relying on a single metric. Each task should be paired with multiple metrics to provide a thorough view of performance from different angles [4]. This helps prevent over-optimization for a single benchmark and ensures that the results are biologically relevant [3] [4]. The benchmark design should also allow for flexible filtering and aggregation of these metrics to suit different user needs [1] [63].
Technical Implementation and Execution
Q4: What are the biggest technical hurdles in running a collaborative benchmark, and how can we overcome them? The main hurdles involve managing software environment reproducibility and workflow execution across diverse computing infrastructures [1] [63] [16]. Best practices to overcome these include:
- Containerization: Use technologies like Docker or Singularity to package software and dependencies.
- Workflow Management Systems: Employ systems like Nextflow or Snakemake to orchestrate analysis pipelines, ensuring portability and scalability across different environments (cloud, HPC) [16].
- Formalized Components: Use tools like Viash to standardize method implementations, transforming scripts into reproducible, versioned components that can be seamlessly integrated into workflows [16].
Q5: Our benchmarking workflows are slow and don't scale. What can we do?
Leverage workflow managers like Nextflow that are designed for scalable execution. Platforms like the Seqera Platform can then manage the execution, providing elastic scaling on cloud providers (AWS Batch, Google Batch) or HPC clusters. This allows workflows to dynamically request appropriate computational resources (e.g., lowcpu, highmem, gpu) based on the task [16].
Analysis and Community Engagement
Q6: How should we analyze and present results to avoid bias and provide actionable insights? Move beyond simple rankings. Since bioinformatics tasks are often evaluated with multiple metrics, provide interactive dashboards that allow users to filter and explore results based on metrics or datasets relevant to them [1] [63]. Highlight different strengths and trade-offs among the top-performing methods rather than declaring a single "winner" [3]. Transparency is key: make all code, workflow definitions, and software environments openly available for scrutiny [1].
Q7: How can we encourage sustained community participation and prevent "benchmarking fatigue"? Adopt a model of "living benchmarks" that can be updated with new methods, datasets, and metrics over time [1] [16]. This transforms the benchmark from a one-time publication into a continuous community resource. Foster collaboration by involving method authors in the process, using open governance models, and publicly crediting all contributions [3] [16].
Troubleshooting Guides
Issue: Inconsistent or Non-Reproducible Results Across Different Compute Environments
| Potential Cause | Solution | Related Tools/Standards |
|---|---|---|
| Divergent software versions or operating systems. | Package all methods and workflows in containers (Docker/Singularity) to create isolated, consistent environments [27] [16]. | Docker, Singularity |
| Hard-coded paths or environmental assumptions in method code. | Use workflow systems to manage file paths. Implement methods as modular components with standardized input/output interfaces [16]. | Viash, Nextflow, Snakemake |
| Non-versioned code or data. | Use version control systems (e.g., Git) for all code and a data provenance system to track dataset versions. | Git, RO-Crate [63] |
Issue: Challenge Participation is Low
| Potential Cause | Solution | Related Examples |
|---|---|---|
| High barrier to entry for method submission. | Provide tools that lower the technical burden, like scripts to automatically wrap method code into standardized containers and workflows [4] [16]. | Viash in OpenProblems [16], CZI benchmarking suite [4] |
| Lack of visibility or perceived impact. | Partner with established community networks and consortia (e.g., DREAM, CASP) to promote the challenge. Ensure results are published and recognized by the community [3] [78]. | DREAM Challenges [78] |
| Method authors are concerned about unfair evaluation. | Ensure neutrality, use blinding strategies where appropriate, and involve a broad, balanced research team to run the benchmark [3]. |
Issue: Benchmark is Becoming Obsolete or Has Been Overfitted
| Potential Cause | Solution | Related Examples |
|---|---|---|
| Static benchmark with a fixed set of tasks and data. | Design the benchmark as a living ecosystem. Allow community contributors to propose new tasks, contribute evaluation data, and share models to keep the benchmark dynamic and relevant [4] [16]. | OpenProblems.bio [16] |
| Methods are over-optimized for specific benchmark datasets and metrics. | Use held-out evaluation sets that are not publicly available. Regularly refresh and expand the benchmark datasets and consider multiple metrics to assess biological relevance beyond narrow technical performance [4]. | CZI's plan for held-out data [4] |
Experimental Protocols for Benchmarking Studies
Protocol 1: Establishing a Gold Standard for Validation
Objective: To create a trusted reference dataset ("ground truth") for evaluating computational methods.
Methodology:
- Trusted Technology: Apply a highly accurate, low-noise experimental technology (e.g., Sanger sequencing for genetic variants) to a biological sample to generate the reference [27].
- Integration and Arbitration: If no single technology is sufficient, integrate results from multiple experimental procedures and computational tools to generate a consensus set. This approach, used by the Genome in a Bottle (GIAB) Consortium, reduces false positives but requires careful handling of potential disagreements and incompleteness [27].
- Synthetic Mock Communities: For complex systems like microbiomes, create an artificial community by mixing known quantities of biological elements (e.g., microbial organisms). This provides a controlled ground truth, though it may be less complex than a natural sample [27].
Materials:
- High-accuracy experimental platform (e.g., Sanger sequencer, qPCR machine).
- Reference biological sample or synthetic mock community components.
Protocol 2: Formalizing a Benchmarking Workflow
Objective: To define and execute a reproducible, scalable benchmarking pipeline.
Methodology:
- Component Specification: Define each method, dataset, and metric as a standalone, versioned component. Tools like Viash can be used to script this process, ensuring each component specifies its software environment, inputs, and outputs [16].
- Workflow Assembly: Use a workflow management system like Nextflow or Snakemake to assemble these components into a complete pipeline. The workflow defines the execution order and data flow between components [63] [16].
- Execution and Scaling: Execute the workflow using a platform that can handle scalable and portable execution, such as the Seqera Platform. This allows the benchmark to run efficiently on cloud or HPC resources by matching tasks to appropriate hardware (e.g., CPU, high memory, GPU) [16].
The following diagram illustrates the structure and flow of this formalized benchmarking workflow.
Protocol 3: Designing a Neutral Benchmarking Study
Objective: To conduct an unbiased comparison of computational methods.
Methodology:
- Comprehensive Method Inclusion: Aim to include all available methods for a given task. Define clear, impartial inclusion criteria (e.g., freely available, installable without errors) and justify the exclusion of any widely used methods [3].
- Neutral Execution: To minimize bias, the research team should be equally familiar with all methods, reflecting typical usage by independent researchers. Alternatively, involve the original method authors to ensure each method is evaluated under optimal conditions [3].
- Avoid Tuning Bias: Apply the same level of parameter tuning and bug-fixing effort to all methods. Using blinding strategies, where the identity of methods is hidden during initial evaluation, can help prevent unconscious bias [3].
The Scientist's Toolkit: Essential Research Reagents & Infrastructure
The following table details key resources for establishing a collaborative benchmarking ecosystem.
| Tool/Resource | Type | Function in Benchmarking |
|---|---|---|
| Container Technology (Docker/Singularity) [27] [16] | Software Environment Tool | Creates reproducible, isolated software environments for each computational method, ensuring consistent execution. |
| Workflow Management System (Nextflow/Snakemake) [63] [16] | Execution Orchestrator | Defines, executes, and manages the flow of data and tasks in a portable and scalable manner across different computing platforms. |
| Viash [16] | Component Builder | Bridges the gap between scripts and pipelines by automatically wrapping code into standardized, containerized components ready for workflow integration. |
| Seqera Platform [16] | Execution Platform | Provides a unified interface for running and monitoring workflows at scale on cloud and HPC infrastructure, handling resource management and queuing. |
| Gold Standard Datasets (e.g., from GIAB) [27] | Reference Data | Provides a trusted ground truth for validating method accuracy and performance in the absence of a known experimental truth. |
| OpenProblems.bio [16] | Benchmarking Framework | A community-run platform that provides a formalized structure for tasks, datasets, methods, and metrics, facilitating "living" benchmarks. |
| CZI Benchmarking Suite [4] | Benchmarking Toolkit | A suite of tools and tasks for evaluating AI models in biology, including a Python package and web interface for easy adoption. |
In computational biology, benchmarking is the conceptual framework used to evaluate the performance of computational methods for a given task. A well-executed benchmark provides the community with neutral, rigorous comparisons that guide method selection and foster development [1] [3]. The ultimate goal of a modern benchmarking study is not to crown a single winner, but to systematically illuminate the strengths, weaknesses, and trade-offs of different methods across a variety of realistic conditions and performance metrics [3].
This technical support center is built on the thesis that benchmarking is a multifaceted ecosystem. It provides FAQs and troubleshooting guides to help researchers navigate the practical challenges of setting up, running, and interpreting rigorous benchmark studies.
Frequently Asked Questions (FAQs)
FAQ 1: What are the different types of benchmarking studies? Benchmarking studies generally fall into three categories. Method Development Papers (MDPs) are conducted by tool developers to demonstrate the merits of a new method against existing ones. Benchmark-Only Papers (BOPs) are "neutral" studies performed by independent groups to systematically compare a set of existing methods. Community Challenges are larger-scale efforts organized by consortia like DREAM or CAFA, where method authors compete to solve a defined problem [1] [3].
FAQ 2: Why is it critical to use a variety of datasets in a benchmark? Method performance is often dependent on specific data characteristics. Using a diverse set of datasets—including both simulated data (with a known ground truth) and real experimental data—ensures that methods are evaluated under a wide range of conditions. This practice prevents recommendations from being biased toward a method that only works well on one specific data type [3].
FAQ 3: What are common trade-offs in high-performance computational genomics? Modern genomic analysis involves navigating several key trade-offs. Accuracy is often traded for speed and lower memory usage, especially with approaches like data sketching. There is also a trade-off between infrastructure cost and analysis time; for example, a slower local analysis may be cheaper, while specialized hardware in the cloud is faster but more expensive. Furthermore, users must balance the complexity of infrastructure setup against the performance benefits of using accelerators like GPUs or FPGAs [79].
FAQ 4: How should methods be selected for a neutral benchmark? A neutral benchmark should strive to be as comprehensive as possible, including all available methods for a given type of analysis. To ensure fairness and practicality, pre-defined inclusion criteria should be established, such as the requirement for a freely available software implementation and the ability to be installed and run without excessive troubleshooting [3].
FAQ 5: My tool failed to run on a benchmark dataset. How should this be handled? Method failures are informative results, not just inconveniences. The failure should be documented transparently in the benchmark results, including the error message and the conditions under which it occurred. Investigating the root cause (e.g., out-of-memory, software dependency conflict, or unhandled data format) can provide valuable insights for both method users and developers [3].
Troubleshooting Common Benchmarking Issues
Problem 1: Software Version and Database Incompatibility
- Symptoms: A tool (e.g., BLAST+) fails to run with an error about an invalid or unsupported database version.
- Diagnosis: This is a classic compatibility issue where an older version of the software cannot read a database formatted by a newer version. For example, BLAST databases version 5 are not compatible with BLAST+ versions older than 2.10.0 [80].
- Solution:
- Check the software version (
blastp -version). - Update the software to the latest stable release.
- If you must use an older version, ensure you download the corresponding version of the database (e.g., using the
--blastdb_version 4flag withupdate_blastdb.pl) [80].
- Check the software version (
Problem 2: Sequence Alignment Parsing Errors
- Symptoms: A phylogeny tool (e.g., RAxML) fails with an error stating that "the last sequence in the alignment seems to have a different length" [19].
- Diagnosis: The input FASTA file is not a valid alignment. In a true multiple sequence alignment, all sequences must be of identical length, including gaps. This error indicates that at least one sequence is shorter or longer than the others.
- Solution:
- Visually inspect the end of your FASTA file to check for obvious length discrepancies.
- Use a tool like
alvor a script to check the length of every sequence in the file. - Re-align your sequences using a dedicated multiple sequence alignment tool (e.g., MAFFT, Clustal Omega) before using the file with RAxML [19].
Performance Metrics and Data
Table 1: Common Performance Metrics in Computational Benchmarking
| Metric Category | Specific Metric | Definition and Interpretation |
|---|---|---|
| Statistical Performance | Precision / Recall | Measures the trade-off between false positives and false negatives; critical for classification tasks. |
| Expect Value (E-value) | In sequence searching, the number of hits one can expect to see by chance. A lower E-value indicates a more significant match [81]. | |
| Computational Performance | Wall-clock Time | Total real time to complete a task, indicating practical speed. |
| Peak Memory Usage | Maximum RAM consumed, critical for large datasets. | |
| CPU Utilization | Efficiency of multi-core/threaded tool usage. |
Table 2: Example Research Reagent Solutions for Benchmarking
| Reagent / Resource | Function in Benchmarking |
|---|---|
| Reference Datasets | Provide the ground truth for evaluating method accuracy; can be simulated (with known truth) or real (e.g., with spike-ins) [3]. |
| Workflow Management System | Orchestrates standardized workflows, ensuring analyses are reproducible and portable across different computing environments [1]. |
| Software Container | Packages a tool and all its dependencies into a single, reproducible unit, eliminating "works on my machine" problems [1]. |
| ClusteredNR Database | A clustered version of the NCBI nr protein database that enables faster BLAST searches and easier interpretation of results by grouping highly similar sequences [81]. |
Experimental Protocols for Robust Benchmarking
Protocol 1: Designing a Neutral Benchmarking Study
- Define Scope and Purpose: Clearly articulate the biological question and the class of methods being evaluated. Decide if the study will be a neutral BOP or an MDP [3].
- Select Methods and Datasets: Apply pre-defined, unbiased inclusion criteria for method selection. Curate a diverse set of benchmark datasets that reflect real-world variability, including both simulated and experimental data [3].
- Establish Computational Environment: Use containerization (e.g., Docker, Singularity) or workflow systems (e.g., Nextflow, Snakemake) to ensure a consistent and reproducible software environment for all method runs [1].
- Execute and Monitor Runs: Run all methods on the benchmark datasets. Meticulously log all successes, failures, and resource consumption (time, memory) [3].
- Evaluate and Interpret: Calculate a range of performance metrics. Analyze the results to highlight trade-offs rather than declaring a single winner. Contextualize findings according to the study's initial purpose [3].
Protocol 2: Setting Up for Continuous Benchmarking
- Formalize Benchmark Definition: Create a configuration file that specifies all components of the benchmark: datasets, method implementations (with versions), software environments, parameters, and metrics [1].
- Orchestrate with Workflows: Implement the benchmark as an automated workflow, allowing for easy re-runs when methods or datasets are updated [1].
- Integrate with CI/CD: Connect the benchmarking workflow to a continuous integration system. This allows for automatic execution whenever a method's code is updated, facilitating continuous performance tracking [1].
- Standardize Result Reporting: Use standardized formats for output and metrics to enable meta-analysis and the combination of results from multiple benchmark studies over time [1].
Benchmarking Ecosystem Workflow
The following diagram illustrates the layered architecture of a continuous benchmarking ecosystem, showing how different components interact to produce reliable, reusable results.
Frequently Asked Questions (FAQs)
FAQ 1: What are the key performance metrics for clinical readiness? For a benchmark to be considered 'good enough' for clinical translation, it must demonstrate robust performance across multiple metrics, not just a single measure. Key metrics include discrimination (e.g., Area Under the Receiver Operating Characteristic Curve, AUROC), calibration (e.g., Calibration-in-the-Large), and overall accuracy (e.g., Brier score) [82]. The specific thresholds vary by clinical application, but benchmarks must be evaluated on their ability to generalize to external data sources and diverse patient populations, with minimal performance deterioration [82].
FAQ 2: How do we select appropriate datasets for clinical benchmarking? A rigorous clinical benchmark utilizes a combination of dataset types to ensure robustness [3] [27]. The table below summarizes the core types and their roles:
| Dataset Type | Role in Clinical Benchmarking | Key Considerations |
|---|---|---|
| Experimental/Real-World Data [27] | Provides realism; used with a trusted "gold standard" for validation (e.g., Sanger sequencing, expert manual evaluation) [83] [27]. | Gold standards can be costly and may not cover all sample elements, leading to incomplete truth sets [27]. |
| Simulated/Synthetic Data [25] [3] | Provides a complete "ground truth" for quantitative performance metrics on known signals [3]. | Must accurately reflect the complexity and properties of real clinical data to avoid oversimplification and bias [25] [3]. |
| Mock Communities [27] | Artificial mixtures with known composition (e.g., titrated microbial organisms); useful for controlled testing. | Risk of oversimplifying reality compared to complex, real-world clinical samples [27]. |
FAQ 3: What are common pitfalls when moving from benchmark to clinical application? The most significant pitfall is a failure in external validation, where a model's performance deteriorates when applied to data from different healthcare facilities, geographies, or patient populations [82]. Other pitfalls include overfitting to static benchmarks, where models are optimized for benchmark success rather than biological relevance or clinical utility [4], and the "self-assessment trap," where developers benchmark their own tools without neutral, independent comparison [25] [26].
FAQ 4: How can we ensure our benchmarking study is reproducible and trusted? To ensure reproducibility and build trust, follow these principles: share all code, software environments, and parameters used to run the tools, ideally using containerization (e.g., Docker) [25] [1]; make raw output data and evaluation scripts publicly available so others can apply their own metrics [25] [26]; and provide a flexible interface for downloading the input raw data and gold standard data [25]. Transparency in how the benchmark was conducted is the foundation for trustworthiness [26].
Troubleshooting Guides
Issue 1: Model Performance is High Internally but Fails on External Data
Problem: Your computational tool shows excellent performance on your internal (development) dataset but performs poorly when validated on external, independent datasets, a problem known as poor transportability [82].
Solution Steps:
- Implement External Validation Early: Do not wait until the final development stage. Use methods that estimate external performance using summary statistics from external sources, even when patient-level data is inaccessible [82].
- Benchmark Transportability: Systematically test your model on multiple heterogeneous external data sources. A study on clinical prediction models used five large US data sources, with each serving as an internal source and the remaining four as external sources to rigorously assess performance drop [82].
- Use Weighting Techniques: If external unit-level data is unavailable, use statistical methods that assign weights to internal cohort units to reproduce a set of external summary statistics. This creates a weighted performance estimate that approximates true external performance [82].
- Verify Feature Representation: Ensure the set of features (variables) used for weighting is relevant to the model and balanced. Using too many features can make it hard to find a solution, while too few may not adequately approximate the joint data distribution [82].
Issue 2: The "Gold Standard" Benchmark Data is Unavailable or Incomplete
Problem: Many domains of biology lack a perfect, complete "gold standard" dataset for benchmarking, making it difficult to define true positives and false negatives [27].
Solution Steps:
- Employ Integration and Arbitration: Generate a consensus gold standard by integrating results from multiple experimental procedures or technologies. The Genome in a Bottle Consortium used this approach with five sequencing technologies to create a high-quality reference, reducing false positives [27].
- Utilize Curated Databases: For specific genomic elements, use large, curated databases like GENCODE or UniProt-GOA as a benchmark. Be aware that these may be incomplete, so the analysis should account for potential missing elements in the sample [27].
- Establish a Probabilistic Clinical Benchmark: In areas with inherent ambiguity (e.g., radiographic landmark annotation), establish a benchmark based on the distribution of annotations from multiple experts. This probabilistic dataset, which quantifies inter-annotator disagreement, provides a more realistic clinical benchmark than a single "ground truth" point [83].
- Leverage Community Resources: Use emerging, community-driven benchmarking suites that provide standardized tasks, datasets, and metrics. These are designed to be biologically relevant and avoid the biases of custom, one-off benchmarks [4].
Experimental Protocols for Key Benchmarking Analyses
Protocol 1: Quantifying Clinical Annotation Accuracy for Benchmarking
Purpose: To establish a clinically relevant benchmark dataset that quantifies human expert variation, providing a realistic accuracy target for AI tools, such as those for radiographic landmark annotation [83].
Methodology:
- Data Collection & Annotation: Collect a set of clinical images (e.g., 115 pelvic radiographs). Have multiple independent, trained annotators (e.g., five, including surgeons and engineers) label the specific landmarks of interest using a standardized software tool [83].
- Data Standardization (Scaling): Calculate an image-specific scaling factor (η) based on a stable, identifiable anatomical length measurement (L) to standardize skeletal sizes across all images in the dataset [83].
- Formula: ( ηi = \frac{\sum{i=1}^{m} Li}{m Li} )
- Where ( ηi ) is the scaling factor for image i, ( Li ) is the length parameter for image i, and m is the total number of images.
- Coordinate Centralization and Transformation: For each landmark, centralize the scaled coordinates from all annotators around their centroid. Then, transform these coordinates to a standardized orientation of clinical interest (θ) [83].
- Calculate Probabilistic Accuracy: Model the transformed coordinates as a 2D point cloud. Calculate the maximum impact (e.g., angular disagreement, ( θ_{max}^k )) of the point cloud diameter for a given percentage of data points (k%, e.g., 95%), which defines the clinical accuracy benchmark at that confidence threshold [83].
Protocol 2: External Validation of a Clinical Prediction Model
Purpose: To benchmark the real-world performance and transportability of a clinical prediction model by testing it on external data sources that were not used for its training [82].
Methodology:
- Define Cohort and Outcomes: In a given internal data source (e.g., a specific electronic health record database), define a target patient cohort (e.g., patients with pharmaceutically-treated depression) and train models to predict specific outcomes (e.g., risk of fracture, GI hemorrhage) [82].
- Secure External Data Sources: Identify multiple external data sources (e.g., four other large, heterogeneous US databases) that can serve as independent validation cohorts [82].
- Execute External Validation: For each external dataset:
- Redefine the target cohort and extract the necessary features and outcomes.
- Apply the pre-trained model to generate predictions.
- Compare the predictions against the observed outcomes to calculate performance metrics (AUROC, calibration, Brier score) [82].
- Benchmark Against Estimation Methods: Compare the actual external performance with estimates generated by methods that use only summary statistics from the external source, thereby validating the accuracy of these more efficient estimation techniques [82].
Essential Workflow Diagrams
Clinical Benchmarking Workflow
External Validation Process
The Scientist's Toolkit: Research Reagent Solutions
| Item | Function in Clinical Benchmarking |
|---|---|
| Containerization Software (e.g., Docker) [25] | Packages software tools with all dependencies into portable, computable environments (containers), ensuring identical software stacks across different computing platforms and enabling reproducibility. |
| Community Benchmarking Suites (e.g., CZ Benchmarks) [4] | Provides pre-defined, community-vetted tasks, datasets, and multiple metrics for standardized evaluation, reducing the need for custom, one-off pipeline development and enabling direct model comparison. |
| Gold Standard Datasets (e.g., GIB Consortium data) [27] | Serves as a high-accuracy reference for validating computational methods. These are often created by integrating multiple technologies or through expert manual annotation and are treated as the "ground truth." |
| Probabilistic Benchmark Datasets [83] | Provides a quantification of human expert variation for a clinical task (e.g., landmark annotation), establishing a realistic, distribution-based accuracy target for AI tools rather than a single "correct" answer. |
| Workflow Management Systems [1] | Orchestrates and automates the execution of benchmarking workflows, helping to manage software versions, parameters, and data flow, which increases the transparency and scalability of benchmarking studies. |
Conclusion
Effective benchmarking is not a one-time exercise but a continuous, community-driven process essential for progress in computational biology. The key takeaways underscore the necessity of neutral, well-defined studies that serve diverse stakeholders, the importance of robust methodologies and formal workflows for reproducibility, and the critical need to move beyond simple rankings to nuanced performance interpretation. Future advancements hinge on building sustainable benchmarking ecosystems that can rapidly integrate new methods and datasets. For biomedical and clinical research, this translates into more reliable computational tools, increased confidence in silico discoveries, and ultimately, an accelerated path from genomic data to actionable biological insights and therapeutic breakthroughs. The future of the field depends on our collective commitment to rigorous, transparent, and continuously updated benchmarking practices.
References
- 1. Building a continuous benchmarking ecosystem in ... [https://journals.plos.org/ploscompbiol/article?id=10.1371/journal.pcbi.1013658]
- 2. Building a continuous benchmarking ecosystem in ... [https://arxiv.org/html/2409.15472v1]
- 3. Essential guidelines for computational method benchmarking [https://genomebiology.biomedcentral.com/articles/10.1186/s13059-019-1738-8]
- 4. Accelerating AI in Biology With Community-Driven ... [https://chanzuckerberg.com/blog/ai-biology-community-benchmarks/]
- 5. [2503.00096] BixBench: a Comprehensive Benchmark for LLM-based... [https://arxiv.org/abs/2503.00096]
- 6. Stakeholder perspectives towards diagnostic artificial ... [https://pmc.ncbi.nlm.nih.gov/articles/PMC10973718/]
- 7. Stakeholder engagement: a key component of integrating ... [https://www.nature.com/articles/gim2013127]
- 8. Q&A: How does computer science advance biology? [https://news.engr.psu.edu/2025/shao-mingfu-koslicki-david-recomb-qanda.aspx]
- 9. v2.0 | SpringerLink Benchmarks [https://link.springer.com/collections/fbeaeecbjh]
- 10. Computational Tools - NCBI - NIH [https://www.ncbi.nlm.nih.gov/books/NBK25460/]
- 11. Tools in Computational Biology [https://www.biosparked.com/course/tools-in-computational-biology]
- 12. Ten simple rules for research with humans [https://journals.plos.org/ploscompbiol/article?id=10.1371/journal.pcbi.1013362]
- 13. Building a continuous benchmarking ecosystem in ... [https://arxiv.org/html/2409.15472v3]
- 14. Systematic benchmarking of computational methods to ... [https://pubmed.ncbi.nlm.nih.gov/40968359/]
- 15. Systematic benchmarking of computational methods to identify ... [https://genomebiology.biomedcentral.com/articles/10.1186/s13059-025-03731-2]
- 16. Enabling Single-Cell Benchmarks at Scale [https://seqera.io/blog/single-cell-benchmarks-openproblems/]
- 17. Bioinformatics Pipeline Troubleshooting [https://www.meegle.com/en_us/topics/bioinformatics-pipeline/bioinformatics-pipeline-troubleshooting]
- 18. Benchmarking Dashboard: Tips for Better Insights [https://chartexpo.com/blog/benchmarking-dashboard]
- 19. fasta format running error.. [https://groups.google.com/g/raxml/c/gffOqMrHnIk]
- 20. FASTA format [https://en.wikipedia.org/wiki/FASTA_format]
- 21. FASTA Format for Nucleotide Sequences - NCBI - NIH [https://www.ncbi.nlm.nih.gov/genbank/fastaformat]
- 22. Error in blast+ [https://www.biostars.org/p/9581711/]
- 23. Commandline BLAST - errors? [https://www.biostars.org/p/9488090/]
- 24. Troubleshooting “wrong type” or “too long” errors [https://www.dnastar.com/manuals/MegAlignPro/18.0/en/topic/troubleshoot-multiple-alignments]
- 25. Systematic benchmarking of omics computational - PMC tools [https://pmc.ncbi.nlm.nih.gov/articles/PMC6437167/]
- 26. Putting benchmarks in their rightful place: The heart of computational ... [https://journals.plos.org/ploscompbiol/article?id=10.1371/journal.pcbi.1006494]
- 27. Systematic benchmarking of omics computational tools [https://www.nature.com/articles/s41467-019-09406-4]
- 28. What Is Ground Truth in Machine Learning? [https://www.ibm.com/think/topics/ground-truth]
- 29. Ground truth generation and review best practices for ... [https://aws.amazon.com/blogs/machine-learning/ground-truth-generation-and-review-best-practices-for-evaluating-generative-ai-question-answering-with-fmeval/]
- 30. An analytical comparison of datasets of Real-World and ... [https://www.sciencedirect.com/science/article/pii/S0263224122010429]
- 31. Benchmarking Methodology [https://bbbc.broadinstitute.org/benchmarking]
- 32. 1.1. Quick Start [https://www.commonwl.org/user_guide/introduction/quick-start.html]
- 33. Snakemake | Snakemake 9.14.0 documentation [https://snakemake.readthedocs.io/]
- 34. Nextflow [https://en.wikipedia.org/wiki/Nextflow]
- 35. Snakemake [https://snakemake.github.io/]
- 36. Nextflow: A DSL for parallel and scalable computational ... [https://www.nextflow.io/]
- 37. Intro to the Common Workflow Language | Griffith Lab [https://pmbio.org/module-09-cwl/0009/01/01/Intro_to_CWL/]
- 38. nextflow-io/nextflow: A DSL for data-driven computational ... [https://github.com/nextflow-io/nextflow]
- 39. Implementation of FAIR Practices in Computational ... [https://pmc.ncbi.nlm.nih.gov/articles/PMC10891576/]
- 40. Applying the FAIR Principles to computational workflows [https://www.nature.com/articles/s41597-025-04451-9]
- 41. Meta-analysis of (single-cell method) benchmarks reveals the ... [https://genomebiology.biomedcentral.com/articles/10.1186/s13059-023-02962-5]
- 42. FAIR data principles: What you need to know [https://tiledb.com/blog/fair-data-principles-explained]
- 43. Understanding FAIR vs Open Data in Life Sciences [https://ranchobiosciences.com/2025/01/unlocking-data-potential-understanding-fair-vs-open-data-in-life-sciences/]
- 44. The self-assessment trap: can we all be better than average? [https://pmc.ncbi.nlm.nih.gov/articles/PMC3261704/]
- 45. Ethical and Bias Considerations in Artificial Intelligence ... [https://www.sciencedirect.com/science/article/pii/S0893395224002667]
- 46. A benchmark of computational methods for correcting biases ... [https://genomebiology.biomedcentral.com/articles/10.1186/s13059-024-03336-1]
- 47. Building a continuous benchmarking ecosystem in ... [https://pubmed.ncbi.nlm.nih.gov/41231865/]
- 48. An Approach to Identifying and Quantifying Bias in Biomedical ... [https://pubmed.ncbi.nlm.nih.gov/36540987/]
- 49. Computational Biology Methods and Their Application to ... [https://pmc.ncbi.nlm.nih.gov/articles/PMC3055744/]
- 50. FAQ — Singularity container 2.6 documentation [https://docs.sylabs.io/guides/2.6/user-guide/faq.html]
- 51. Troubleshooting in Azure Container Apps [https://learn.microsoft.com/en-us/azure/container-apps/troubleshooting]
- 52. Any good strategies for dealing with 'not reproducible' bugs? [https://stackoverflow.com/questions/1050552/any-good-strategies-for-dealing-with-not-reproducible-bugs]
- 53. Optimization Algorithms for Computational Systems Biology [https://www.frontiersin.org/journals/applied-mathematics-and-statistics/articles/10.3389/fams.2017.00006/full]
- 54. Optimization in computational systems biology [https://bmcsystbiol.biomedcentral.com/articles/10.1186/1752-0509-2-47]
- 55. Global optimization in systems biology: stochastic methods ... [https://pubmed.ncbi.nlm.nih.gov/22161343/]
- 56. Robust parameter estimation and identifiability analysis ... [https://www.nature.com/articles/s41540-024-00460-3]
- 57. Parameter tuning is a key part of dimensionality reduction via ... [https://pubmed.ncbi.nlm.nih.gov/30963075/]
- 58. Speeding Up Ecological and Evolutionary Computations in R [https://pmc.ncbi.nlm.nih.gov/articles/PMC4374948/]
- 59. A short guide to Slurm for Biologist transitioning ... [https://francesco-oteri.medium.com/a-short-guide-to-slurm-for-biologist-transitioning-to-computational-biology-ee4f7eaf6c45]
- 60. Computation and biology: a partnership [https://www.nature.com/articles/s41592-021-01215-2]
- 61. Computational solutions to large-scale data management and ... [https://pmc.ncbi.nlm.nih.gov/articles/PMC3124937/]
- 62. Computational Storage → Term [https://prism.sustainability-directory.com/term/computational-storage/]
- 63. Building a continuous benchmarking ecosystem in ... [https://pmc.ncbi.nlm.nih.gov/articles/PMC12614554/]
- 64. Essential guidelines for computational method benchmarking [https://pmc.ncbi.nlm.nih.gov/articles/PMC6584985/]
- 65. Benchmark Testing Process, Benefits, and Best Practices [https://www.qatouch.com/blog/benchmark-testing/]
- 66. Benchmark Software Testing: Best Practices & Tips - Abstracta [https://abstracta.us/blog/performance-testing/benchmark-software-testing/]
- 67. A Guide to Measuring and Optimizing System Performance [https://www.linkedin.com/pulse/benchmark-testing-guide-measuring-optimizing-system-performance-bvt9c]
- 68. Mean Squared Error: Definition and Example [https://www.statisticshowto.com/probability-and-statistics/statistics-definitions/mean-squared-error/]
- 69. Mean Squared Error: Overview, Examples, Concepts and ... [https://medium.com/@amit25173/mean-squared-error-overview-examples-concepts-and-more-bf3e9a713566]
- 70. User's guide to correlation coefficients - PMC [https://pmc.ncbi.nlm.nih.gov/articles/PMC6107969/]
- 71. Interpreting Correlation Coefficients [https://statisticsbyjim.com/basics/correlations/]
- 72. Key Issues Associated with Classification Accuracy [https://www.kdnuggets.com/2023/03/key-issues-associated-classification-accuracy.html]
- 73. Understanding Literacy Screening: Classification Accuracy [https://www.improvingliteracy.org/resource/understanding-literacy-screening-classification-accuracy]
- 74. Toward Standards in Clinical Microbiota Studies [https://pmc.ncbi.nlm.nih.gov/articles/PMC7018525/]
- 75. Unlocking Reliable 16S rRNA Analysis: A Benchmarking Gold ... [https://communities.springernature.com/posts/unlocking-reliable-16s-rrna-analysis-a-benchmarking-gold-standard-ground-truth]
- 76. Measure metagenomics accuracy with a simple 0-100 score [https://www.zymoresearch.com/blogs/blog/how-to-quantify-bias-with-mock-microbial-community-standards?srsltid=AfmBOor3x-FG6X93i1uaAN59VJcVFW8tvRg68APbEstWm3yHwTqL9rsX]
- 77. Mock community taxonomic classification performance of ... [https://www.nature.com/articles/s41597-023-02877-7]
- 78. Schedule for DREAM [https://www.iscb.org/cms_addon/conferences/ismbeccb2025/schedule/detailed?track=DREAM]
- 79. Navigating bottlenecks and trade-offs in genomic data analysis [https://pmc.ncbi.nlm.nih.gov/articles/PMC10204111/]
- 80. BLASTP version 4 database error *Help [https://www.biostars.org/p/448060/]
- 81. Frequently Asked Questions — BLASTHelp documentation - NIH [https://blast.ncbi.nlm.nih.gov/doc/blast-help/FAQ.html]
- 82. Extensive benchmarking of a method that estimates ... [https://pmc.ncbi.nlm.nih.gov/articles/PMC11772677/]
- 83. Clinical benchmark dataset for AI accuracy analysis [https://www.nature.com/articles/s41597-024-04003-7]