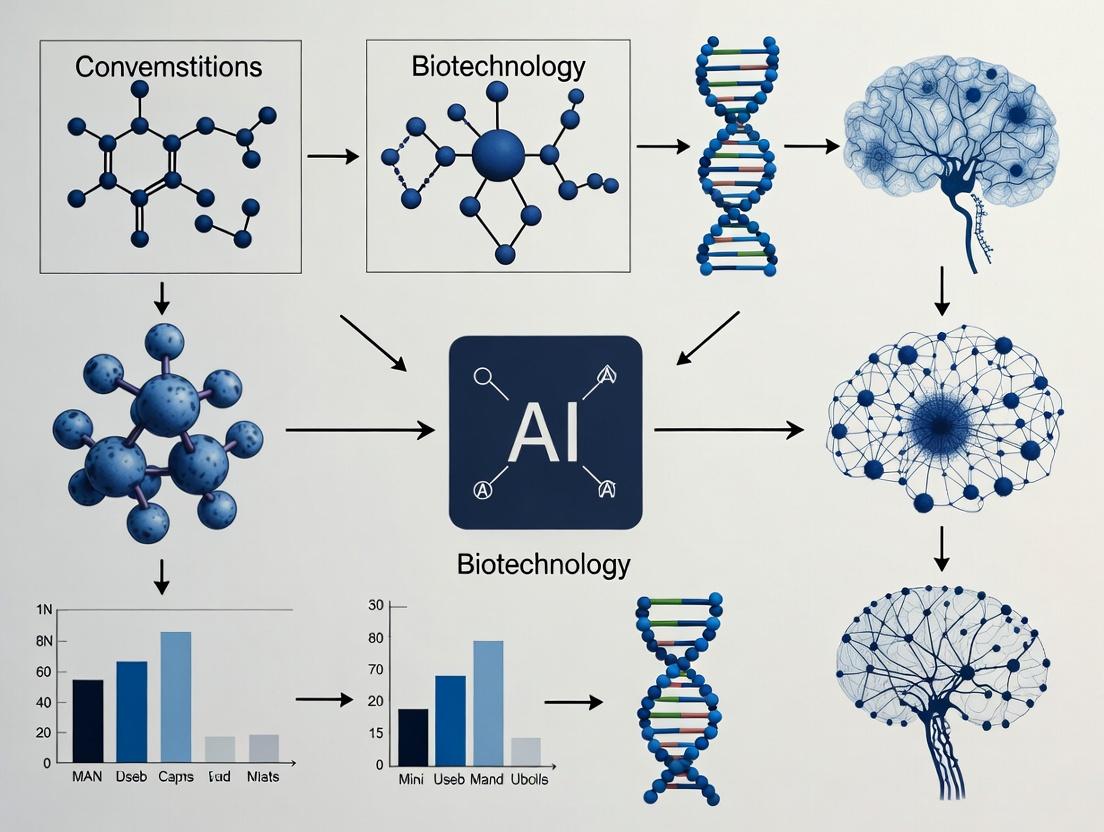
AI and Biotechnology Convergence: Revolutionizing Drug Discovery and Biomedical Research in 2024
This article provides a comprehensive overview of the transformative convergence of artificial intelligence (AI) and biotechnology for researchers, scientists, and drug development professionals.
AI and Biotechnology Convergence: Revolutionizing Drug Discovery and Biomedical Research in 2024
Abstract
This article provides a comprehensive overview of the transformative convergence of artificial intelligence (AI) and biotechnology for researchers, scientists, and drug development professionals. We explore the foundational principles, core methodologies, and real-world applications where AI—from generative models to deep learning—is accelerating the pace of discovery. We address critical challenges in data integration and model interpretability, offer comparative analyses of leading AI tools, and validate the impact through key case studies in drug design and biomarker identification. This analysis synthesizes the current landscape and outlines the future trajectory of this powerful synergy for advancing precision medicine and therapeutic innovation.
From Code to Cure: Defining the AI-Biotech Convergence and Its Core Paradigms
This whitepaper, framed within a broader thesis on AI-biotechnology convergence, delineates the core computational paradigms—Artificial Intelligence (AI), Machine Learning (ML), and Deep Learning (DL)—through the lens of biological systems and biomedical research. For researchers and drug development professionals, this mapping is not merely metaphorical but foundational for developing biologically-inspired algorithms and applying AI to decode complex biological data.
Conceptual Definitions in a Biological Context
- Artificial Intelligence (AI) is the overarching science of creating systems capable of performing tasks that typically require biological intelligence. In a biological context, AI aims to emulate or understand the phenomenon of intelligence itself, akin to studying the integrative function of a nervous system that processes sensory input, maintains homeostasis, and generates adaptive behavior.
- Machine Learning (ML) is a subset of AI focused on algorithms that learn patterns and make decisions from data without being explicitly programmed for every rule. This mirrors adaptive biological processes such as immunological memory, where the immune system learns from exposure to pathogens and improves its response upon subsequent encounters.
- Deep Learning (DL) is a specialized subset of ML inspired by the structure and function of the brain's neural networks. DL utilizes artificial neural networks (ANNs) with multiple layers ("deep" architectures) to learn hierarchical representations of data. This is analogous to the hierarchical sensory processing in the visual cortex, where simple edges and contours detected in early layers are progressively integrated into complex representations like objects and faces in deeper layers.
Quantitative Landscape of AI/ML in Biomedical Research
The integration of these technologies into biotechnology is evidenced by rapid growth in publications, investments, and clinical pipelines. The following table summarizes key quantitative data.
Table 1: Quantitative Metrics of AI/ML in Biomedicine (2022-2024)
| Metric Category | Specific Metric | Estimated Figure (Source Year) | Notes & Context |
|---|---|---|---|
| Market & Investment | Global AI in Drug Discovery Market | \$1.6B (2023) | Projected to grow at a CAGR of ~28% from 2024-2030. |
| Market & Investment | Venture Capital Funding (AI-Bio companies) | > \$5B (2023 aggregate) | Reflects strong investor confidence in the convergence. |
| Research Output | PubMed Citations for "Deep Learning" & "Drug Discovery" | ~4,500 (2023) | Demonstrates a near-exponential increase from ~200 in 2015. |
| Clinical Pipeline | Active Drug Discovery Programs using AI/ML | > 250 (2024) | Led by small-molecule and oncology-focused programs. |
| Performance Benchmark | AI-predicted Protein Structures (AlphaFold2) | Median RMSD ~1Å | Revolutionized structural biology with near-experimental accuracy. |
Experimental Protocol: Applying DL to Transcriptomic Data for Novel Biomarker Discovery
This protocol details a standard workflow for using a Deep Learning model (a deep autoencoder) to identify novel gene expression signatures from high-dimensional RNA-seq data.
Objective: To compress high-dimensional transcriptomic data into a latent low-dimensional representation that captures essential biological variance, enabling the discovery of novel clusters or biomarkers associated with a disease state (e.g., cancer subtypes).
Materials & Workflow:
Table 2: Research Reagent Solutions & Key Materials
| Item | Function in Experiment |
|---|---|
| Processed RNA-seq Dataset (e.g., TCGA, GEO) | Input data; matrix of normalized gene expression counts (samples x genes). |
| High-Performance Computing (HPC) Cluster or Cloud GPU (e.g., NVIDIA V100/A100) | Provides the computational power required for training deep neural networks. |
| Python 3.8+ with Libraries: TensorFlow/PyTorch, Scanpy, Scikit-learn | Core programming environment and ML/DL frameworks for model implementation and data analysis. |
| Dimensionality Reduction Tools: UMAP, t-SNE | Used post-DL for 2D/3D visualization of the latent space learned by the model. |
| Clustering Algorithm: Leiden or Louvain | Applied on the latent representations to identify novel sample clusters. |
| Differential Expression Analysis Tool: DESeq2, edgeR | Validates clusters by identifying statistically significant gene expression differences. |
Methodology:
- Data Preprocessing: Load normalized expression matrix (e.g., TPM or FPKM). Apply log2(1+x) transformation. Select top 5,000 highly variable genes (HVGs) to reduce noise and computational load.
- Autoencoder Architecture Design:
- Encoder: A fully connected neural network with layers: Input (5000 nodes) → 1024 (ReLU) → 256 (ReLU) → 64 (ReLU) → Latent Space (32 nodes, linear).
- Decoder: A symmetric network: Latent (32) → 64 (ReLU) → 256 (ReLU) → 1024 (ReLU) → Output (5000, linear).
- Loss Function: Mean Squared Error (MSE) between original and reconstructed input.
- Model Training: Split data into training (80%) and validation (20%) sets. Train using Adam optimizer with a learning rate of 1e-4 and batch size of 32 for 200 epochs. Monitor validation loss for early stopping to prevent overfitting.
- Latent Space Extraction & Analysis: After training, pass all samples through the encoder to obtain the 32-dimensional latent vector for each sample.
- Visualize the latent space using UMAP.
- Perform graph-based clustering (Leiden algorithm) on the latent vectors.
- Biological Validation: Perform differential expression analysis between model-identified clusters. Conduct pathway enrichment analysis (e.g., using Gene Ontology, KEGG) on differentially expressed genes to assign biological meaning to the novel subtypes.
Visualizing Hierarchical Learning and Biological Analogy
AI DL vs Biological Visual Pathway Analogy
Transcriptomic Biomarker Discovery Workflow
This whitepaper, framed within a broader thesis on AI and biotechnology convergence, delineates the critical historical milestones where computational biology and artificial intelligence have synergistically advanced biological discovery and therapeutic development. The integration has evolved from early sequence analysis to the current paradigm of deep learning-driven biomolecular structure prediction and generative AI for drug design.
Key Historical Milestones and Quantitative Data
Table 1: Key Historical Milestones in Computational Biology & AI Integration
| Era | Decade | Milestone (Event/Algorithm/Tool) | Core Innovation | Primary Biological Impact |
|---|---|---|---|---|
| Foundations | 1970s | Needleman-Wunsch Algorithm | Dynamic programming for global sequence alignment | Enabled quantitative comparison of protein/DNA sequences. |
| Foundations | 1980s | Smith-Waterman Algorithm, BLAST | Heuristic local alignment & rapid database search | Revolutionized genomic & proteomic database mining. |
| Systems Biology | 1990s | Hidden Markov Models (e.g., for gene finding) | Probabilistic models for pattern recognition in sequences | Improved genome annotation and gene structure prediction. |
| Omics & Data | 2000s | SVM/RF for microarray & mass-spec data | Machine learning for high-dimensional 'omics' classification | Enabled molecular subtyping of cancers and complex diseases. |
| Deep Learning | 2010s | DeepVariant, DeepBind | CNNs for sequence variant calling & protein-DNA binding | Achieved human-expert level accuracy in genetic variant detection. |
| Structural Revolution | 2020s | AlphaFold2, RoseTTAFold | Geometric deep learning & transformer architectures | Solved the protein folding problem, enabling accurate structure prediction. |
| Generative AI | 2020s | AlphaFold3, RFdiffusion, GFlowNets | Diffusion models & generative networks for biomolecules | De novo design of proteins, antibodies, and therapeutic molecules. |
Table 2: Performance Benchmarks of Key AI Tools in Biology
| Tool/Model (Year) | Primary Task | Key Metric | Performance | Traditional Method Benchmark |
|---|---|---|---|---|
| AlphaFold2 (2020) | Protein Structure Prediction | GDT_TS (CASP14) | ~92.4 (High accuracy) | ~40-60 (Homology modeling) |
| RoseTTAFold (2021) | Protein Structure Prediction | RMSD (Å) | Often <2.0 Å for many targets | N/A |
| DeepVariant (2018) | SNP/Indel Calling | Precision/Recall | >99.5% for SNPs | ~99.0% (GATK Best Practices) |
| ESMFold (2022) | Protein Structure Prediction | Speed (predictions/day) | ~60-80 (on GPU cluster) | AlphaFold2: ~10-20 |
| AlphaFold3 (2024) | Complex Structure Prediction | Interface Accuracy (pTM) | Significant improvement over AF2 | N/A |
Detailed Experimental Protocols for Key Experiments
Protocol: Training and Inference for a Protein Structure Prediction Model (e.g., AlphaFold2 variant)
Objective: To predict the 3D atomic coordinates of a protein from its amino acid sequence using a deep learning model.
Materials:
- Hardware: High-performance computing cluster with multiple GPUs (e.g., NVIDIA A100/V100), ≥ 1TB RAM, high-speed SSD storage.
- Software: Python 3.8+, JAX/DeepMind JAX stack, CUDA/cuDNN, HH-suite, HMMER, Kalign, PDB tools.
- Data: UniRef90 (clustered sequences), BFD/MGnify (metagenomic sequences), PDB70 (structural profiles), PDB (experimental structures for training/validation).
Methodology:
Multiple Sequence Alignment (MSA) Generation:
- Input target sequence into JackHMMER or HHblits to search against sequence databases (UniRef90, BFD).
- Process results to generate a stacked, padded MSA representation.
- In parallel, search against structural database (PDB70) using Hhsearch to generate template features.
Feature Engineering:
- Compute auxiliary features: per-residue and pair representations (position-specific scoring matrices, deletion matrices, residue indices, predicted secondary structure via PSIPRED).
- Template features (if available): distances, orientations, and positional embeddings from homologous structures.
- Combine all features into a fixed-size, batched tensor for model input.
Model Inference (Evoformer & Structure Module):
- Pass processed features through the Evoformer trunk (48 blocks). This module performs iterative, attention-based refinement on the MSA and pair representations.
- Feed the refined pair representation into the Structure Module (8 blocks). This module generates initial 3D frames (rotations and translations) per residue and iteratively refines them using Invariant Point Attention.
- Output final atomic coordinates for all heavy atoms (backbone and side-chains).
Recycling & Confidence Estimation:
- The process may be recycled (3-4 times) where the output structure is used to update the input pair representation.
- The model outputs per-residue (pLDDT) and predicted TM-score (pTM) confidence metrics to assess prediction reliability.
Post-processing:
- Use Amber or OpenMM to perform a brief, constrained energy minimization on the predicted coordinates to correct minor steric clashes.
- Output final model in PDB format.
Protocol:In SilicoVirtual Screening using a Trained Deep Learning Model
Objective: To screen millions of small molecules from a library to identify potential binders for a target protein using a deep learning scoring function.
Materials:
- Software: Docking software (e.g., Autodock Vina, GNINA), deep learning scoring model (e.g., EquiBind, DiffDock), molecular dynamics suite (e.g., GROMACS, OpenMM), RDKit/Open Babel.
- Data: Target protein structure (experimental or predicted), small molecule library (e.g., ZINC20, Enamine REAL), known active/decoy set for validation.
Methodology:
Preparation:
- Prepare protein: add hydrogens, assign partial charges, define binding site box coordinates.
- Prepare ligand library: standardize tautomers, generate 3D conformers, minimize energy, convert to appropriate format (SDF, mol2).
Initial Docking (Traditional):
- Perform rapid, grid-based docking (e.g., Vina) for all library compounds to generate an initial pose and score. Retain top 100,000 poses.
AI-Based Re-scoring & Pose Refinement:
- For each retained pose, extract complex features: atom coordinates, types, distances, and protein-ligand interaction fingerprints.
- Process each complex through a trained Graph Neural Network (GNN) or SE(3)-Equivariant network. This model outputs a refined binding affinity score (pKi/pIC50) and may adjust the ligand pose.
- Rank all compounds based on the AI-predicted score.
MM/GBSA Free Energy Calculation (Optional, for top hits):
- For the top 1,000 ranked complexes, run short (5-10 ns) molecular dynamics simulations in explicit solvent.
- Use the Molecular Mechanics/Generalized Born Surface Area (MM/GBSA) method on trajectory snapshots to compute a more rigorous binding free energy estimate.
- Re-rank based on ΔG_bind (MM/GBSA).
Post-analysis:
- Cluster final top 100 compounds by chemical scaffold.
- Inspect binding modes for key interaction patterns (hydrogen bonds, hydrophobic packing, pi-stacking).
- Output list of prioritized compounds for in vitro testing.
Mandatory Visualizations
AlphaFold2 Prediction Workflow
AI-Enhanced Virtual Screening Pipeline
The Scientist's Toolkit: Research Reagent & Solution Essentials
Table 3: Key Research Reagent Solutions for AI-Driven Computational Experiments
| Category | Item / Solution | Function & Explanation | Example Vendor/Software |
|---|---|---|---|
| Data Curation | PDB (Protein Data Bank) Files | Atomic coordinate files for protein structures; essential for training structure prediction models and benchmarking. | RCSB PDB |
| Data Curation | UniProt/UniRef Clustered Sequences | Comprehensive, clustered protein sequence databases for generating evolutionary insights (MSAs). | UniProt Consortium |
| Feature Engineering | HH-suite (HHblits, HHsearch) | Toolsuite for extremely fast, sensitive protein sequence and structure homology detection. | MPI Bioinformatics Toolkit |
| Model Training | JAX / PyTorch with GPU Support | Deep learning frameworks enabling accelerated, parallel computation on GPUs for large biological models. | Google / Meta |
| Model Deployment | ColabFold (AlphaFold2/3, RoseTTAFold) | Accessible, cloud-based pipeline combining fast MSA generation (MMseqs2) with state-of-the-art folding models. | GitHub / Colab |
| Validation | Molecular Dynamics Suite (GROMACS/OpenMM) | Software for performing physics-based simulations to assess the stability and dynamics of AI-predicted structures. | Open Source |
| Validation | Cryo-EM Map Fitting Software (ChimeraX) | Visualization and tool to fit predicted atomic models into experimental cryo-electron microscopy density maps. | UCSF |
| Wet-Lab Bridge | Gene Fragments (gBlocks) | Synthetic double-stranded DNA fragments for rapid de novo gene synthesis of AI-designed protein sequences. | IDT |
| Wet-Lab Bridge | Cell-Free Protein Expression System | Rapid, in vitro protein synthesis kit to produce and test AI-designed proteins without cell culture. | NEB PURExpress |
| Wet-Lab Bridge | High-Throughput SPR/BLI plates | Microplate-based assay kits for screening binding kinetics of hundreds of AI-predicted ligands in parallel. | Cytiva / Sartorius |
This technical whitepaper, framed within a broader thesis on AI-biotechnology convergence, details the interconnected methodologies driving modern biomedical research. We provide an in-depth analysis of experimental protocols, data integration strategies, and key reagent solutions essential for researchers and drug development professionals operating at the nexus of these core synergy areas.
The convergence of artificial intelligence with biotechnology has created a synergistic feedback loop between drug discovery, genomics, proteomics, and diagnostics. This integration enables a shift from a linear, target-centric approach to a holistic, systems-biology-driven pipeline. AI algorithms, particularly deep learning models, now leverage multi-omic data to predict drug-target interactions, identify novel biomarkers, and stratify patient populations with unprecedented precision. This guide details the technical workflows underpinning this convergence.
Quantitative Data Landscape: A Comparative Analysis
The following tables summarize key quantitative metrics defining the current state and impact of integration across the core areas.
Table 1: Performance Metrics of AI-Integrated Multi-Omic Platforms (2023-2024)
| Platform/Technology Type | Avg. Prediction Accuracy (Target ID) | Time Reduction vs. Traditional Methods | Primary Data Inputs | Key Limitation |
|---|---|---|---|---|
| AlphaFold2 & Variants | 92% (RMSD < 2Å) | ~90% (Structure Prediction) | Genomics, Evolutionary Data | Dynamics/Allostery |
| Generative Chemistry AI | 40-60% (Experimental Hit Rate) | ~70% (Lead Compound Design) | Proteomics, Binding Affinity Data | Synthetic Accessibility |
| Multi-Omic Diagnostic Classifiers | 85-95% (Disease Subtype) | ~95% (Analysis Time) | Genomics (WES/WGS), Proteomics, Metabolomics | Cohort Size Dependence |
| CRISPR sgRNA Design AI | 88% (On-Target Efficiency) | ~50% (Design & Validation) | Genomics, Epigenomics | Off-Target Prediction |
Table 2: High-Throughput Screening & Sequencing Data Output Scale
| Experimental Method | Typical Data Volume per Run | Key Measured Parameters | Primary Synergy Area | Standard Analysis Tool |
|---|---|---|---|---|
| Next-Gen Sequencing (NGS) | 100 GB - 2 TB | SNPs, INDELs, Expression (FPKM/TPM) | Genomics/Diagnostics | GATK, DRAGEN |
| Mass Spectrometry Proteomics | 10 - 100 GB | Peptide Intensity, PTM Identification | Proteomics/Drug Discovery | MaxQuant, Spectronaut |
| High-Content Screening (HCS) | 500 GB - 5 TB | Cell Morphology, Fluorescence Co-localization | Drug Discovery/Diagnostics | CellProfiler, Harmony |
| Single-Cell Multi-Omics | 2 - 10 TB per study | Gene Expression, Surface Protein, Chromatin Acc. | All Four Areas | Seurat, Scanpy |
Experimental Protocols & Methodologies
Integrated Protocol: AI-Guided Target Discovery & Validation
This protocol combines genomic analysis, proteomic validation, and initial compound screening.
A. Genomic Target Identification via GWAS & AI Prioritization
- Cohort Sequencing: Perform Whole Genome Sequencing (WGS) on case-control cohorts (minimum n=5000 per group) using Illumina NovaSeq X Plus. Average coverage: 30x.
- Variant Calling & QTL Mapping: Process raw FASTQ files through BWA-MEM2 alignment and GATK4 variant calling pipeline. Perform expression/metabolite QTL (eQTL/mQTL) analysis using tools like QTLtools.
- AI-Powered Prioritization: Input significant loci (p < 5x10^-8) and linked QTL data into a graph neural network (GNN) trained on known gene-disease networks (e.g., DisGeNET). The model scores genes based on network proximity, functional impact (PolyPhen-2 score), and multi-omic evidence.
- Output: A ranked list of high-confidence candidate disease genes with associated predicted pathogenic pathways.
B. Proteomic Expression & Interaction Validation
- Sample Preparation: Isolate protein from relevant tissue or cell line models (knock-out/knock-in of candidate gene) using RIPA lysis buffer with protease/phosphatase inhibitors.
- Data-Independent Acquisition (DIA) Mass Spectrometry: Digest proteins with trypsin. Analyze peptides on a timsTOF Pro 2 with a 100-min gradient. Use a spectral library for DIA analysis.
- Interaction Proteomics: Perform affinity purification mass spectrometry (AP-MS) on tagged candidate protein. Use CRAPome to filter non-specific interactors.
- Validation: Confirm differential expression (adj. p-val < 0.01, fold change >1.5) and identify significantly enriched protein-protein interaction networks (STRING DB, Cytoscape).
C. High-Throughput Virtual & Biochemical Screening
- Structure Preparation: Obtain candidate protein structure from AlphaFold DB or generate via homology modeling. Prepare with Schrodinger's Protein Preparation Wizard.
- AI-Driven Virtual Screen: Use a generative chemistry model (e.g., REINVENT) trained on binding affinity data to propose 50,000 novel compounds. Dock top 5,000 candidates using GLIDE HTVS/SP/XP workflow.
- In Vitro Confirmation: Procure top 100 ranked compounds from Enamine REAL library. Run a biochemical activity assay (e.g., fluorescence polarization) at 10 µM concentration in triplicate.
- Hit Criteria: Compounds showing >50% inhibition/activity are considered primary hits for lead optimization.
Protocol for Multi-Omic Diagnostic Classifier Development
This protocol outlines the creation of an integrated diagnostic model from plasma samples.
- Multi-Modal Data Collection:
- Cell-Free DNA (cfDNA) WGS: Extract cfDNA from 1mL plasma (QIAseq cfDNA Kit). Prepare libraries (KAPA HyperPrep) and sequence to 0.1x coverage for copy number variation (CNV) and 30x for mutation detection.
- Proteomic & Metabolomic Profiling: Deplete top 14 high-abundance plasma proteins (MARS-14 column). Analyze via Olink Explore 3072 panel (proteomics) and LC-MS/MS untargeted metabolomics (Sciex X500B QTOF).
- Data Processing & Feature Extraction:
- Genomics: Call somatic variants (MuTect2), CNVs (ichorCNA), and fragmentome features (5' end motif analysis).
- Proteomics/Metabolomics: Normalize protein concentrations (NPX) and metabolite intensities (Probabilistic Quotient Normalization). Perform log2 transformation.
- Model Training & Integration: Use a multimodal deep learning architecture (e.g., late-fusion neural network). Train separate encoders for each data type (1D CNN for genomics, fully connected for proteomics/metabolomics). Concatenate final latent representations for a joint classification layer (Softmax output). Perform 5-fold cross-validation.
- Validation: Test on a held-out cohort (n>200). Report AUC, sensitivity, specificity, and PPV at a pre-defined decision threshold.
Visualization of Core Workflows & Pathways
Title: Convergent AI-Driven Pipeline for Diagnostics & Discovery
Title: Oncogenic GPCR Signaling & Drug Intervention Points
The Scientist's Toolkit: Key Research Reagent Solutions
Table 3: Essential Reagents & Kits for Integrated Multi-Omic Research
| Item Name (Example) | Category | Function in Workflow | Key Synergy Area |
|---|---|---|---|
| QIAseq cfDNA All-in-One Kit | Nucleic Acid Extraction | Isolation of high-quality cell-free DNA from liquid biopsies for genomic analysis. | Genomics, Diagnostics |
| Cytiva HisTrap HP Column | Protein Purification | Immobilized metal affinity chromatography (IMAC) for purification of recombinant, tagged target proteins. | Proteomics, Drug Discovery |
| Olink Explore 3072 | Proteomics | Proximity extension assay (PEA) technology for simultaneous, high-specificity measurement of 3072 proteins. | Proteomics, Diagnostics |
| Enamine REAL Diversity Library | Compound Screening | Chemically diverse, synthesis-ready compound collection for high-throughput and virtual screening campaigns. | Drug Discovery |
| 10x Genomics Chromium Single Cell Multiome ATAC + Gene Exp. | Single-Cell Analysis | Simultaneous profiling of gene expression and chromatin accessibility in the same single cell. | Genomics, Proteomics* |
| CellTiter-Glo 3D Cell Viability Assay | Cell-Based Assay | Luminescent measurement of cell viability, optimized for 3D spheroids and organoids. | Drug Discovery |
| Crispr-Cas9 Edit-R Synthetic gRNA | Genome Editing | High-fidelity, pre-designed sgRNA for precise knockout/knock-in to validate genomic targets. | Genomics, Drug Discovery |
| Seahorse XF Cell Mito Stress Test Kit | Metabolic Assay | Real-time measurement of mitochondrial function (OCR, ECAR) in live cells. | Diagnostics, Drug Discovery |
Note: The Multiome kit captures chromatin accessibility (epigenomics) and mRNA, linking genomic regulation to phenotype.
The convergence of artificial intelligence (AI) and biotechnology is predicated on the systematic digitization and computational analysis of fundamental biological and clinical data types. This whitepaper posits that the effective integration and modeling of four core data classes—Genomic Sequences, Protein Structures, Clinical Trial Data, and Real-World Evidence (RWE)—form the essential substrate for AI-driven discovery and development. Mastery over these data types, their unique ontologies, and their interrelationships is the critical path to accelerating target identification, therapeutic design, and evidence generation in modern biopharma.
Genomic Sequences
Genomic sequences represent the primary digital code of biology. In AI-biotech convergence, they are the input layer for predicting disease susceptibility, identifying novel targets, and stratifying patient populations.
Key Quantitative Metrics & Data Standards
Table 1: Core Genomic Sequencing Metrics & File Formats
| Metric/Format | Description | Typical Scale/Size |
|---|---|---|
| Coverage Depth | Number of times a nucleotide is read during sequencing. | 30x-100x for WGS; 100x-500x for targeted panels. |
| Read Length | Number of base pairs in a single sequencing read. | Short-read: 75-300 bp; Long-read (PacBio/Nanopore): 10-100 kb+. |
| Variant Call Format (VCF) | Standard text file format for storing gene sequence variations. | ~50-500 GB for a population-scale project. |
| FASTQ | Text-based format storing raw sequence data and quality scores. | ~90-150 GB per 30x human whole genome. |
| BAM/SAM | Compressed/plain text alignment format for mapped sequences. | ~60-120 GB per 30x human whole genome (BAM). |
Experimental Protocol: Whole Genome Sequencing (WGS) for AI Training Datasets
Objective: Generate high-coverage, high-quality WGS data from patient cohorts for AI model training in variant discovery and association studies.
Methodology:
- Sample Prep & Library Construction: Extract high-molecular-weight DNA from blood or tissue. Fragment DNA, ligate adapters, and amplify using PCR.
- Sequencing: Load library onto Illumina NovaSeq or comparable platform. Perform paired-end sequencing (2x150 bp) to achieve a minimum of 30x mean coverage.
- Primary Analysis (Base Calling): Use onboard software (e.g., Illumina DRAGEN) to convert raw image data to FASTQ files, assigning quality scores (Q-scores) per base.
- Secondary Analysis (Bioinformatics Pipeline): a. Read Alignment: Map FASTQ reads to a reference genome (GRCh38) using BWA-MEM or similar aligner. Output SAM/BAM. b. Variant Calling: Process BAM files for variant discovery. Use GATK HaplotypeCaller for germline SNVs/indels. Apply hard filters (QD < 2.0, FS > 60.0, MQ < 40.0). c. Annotation: Annotate VCF with functional consequences using SnpEff/Ensembl VEP, integrating dbSNP, gnomAD allele frequencies.
Visualization: WGS Data Generation & Analysis Workflow
Diagram Title: Whole Genome Sequencing Data Generation Pipeline
The Scientist's Toolkit: Genomic Sequencing Reagents
Table 2: Key Reagents for High-Throughput Genomic Sequencing
| Reagent / Kit | Vendor Examples | Function |
|---|---|---|
| DNA Fragmentation Enzyme | Covaris dsDNA Shearer, NEBNext dsDNA Fragmentase | Creates uniformly sized DNA fragments for library construction. |
| Library Prep Kit | Illumina DNA Prep, KAPA HyperPrep | End-repair, A-tailing, adapter ligation, and PCR amplification of libraries. |
| Unique Dual Indexes (UDIs) | Illumina IDT for Illumina | Barcodes individual samples, enabling multiplexing and preventing index hopping. |
| Polymerase | Illumina NovaSeq XP, Q5 High-Fidelity DNA Polymerase | Amplifies library fragments with high fidelity during cluster generation and sequencing. |
| Flow Cell | Illumina S1/S2/S4 Flow Cell | Solid-phase surface where bridge amplification and sequencing occur. |
Protein Structures
Protein structural data provides the 3D atomic-level context for understanding function, mechanism, and interaction sites, enabling AI-driven rational drug design.
Table 3: Core Protein Structural Data Metrics & Databases
| Metric/Database | Description | Typical Scale/Resolution |
|---|---|---|
| Resolution | Clarity of detail in an electron density map (Ångstroms). | X-ray: <2.0 Å (High), 2.0-3.0 Å (Medium); Cryo-EM: 1.8-4.0 Å. |
| Protein Data Bank (PDB) | Primary global archive for 3D structural data of proteins/nucleic acids. | >200,000 entries (as of 2024). |
| AlphaFold DB | AI-predicted structure database by DeepMind/EMBL-EBI. | >200 million predicted structures. |
| PDBx/mmCIF | Modern standard file format for PDB entries, superseding legacy PDB. | Single file contains coordinates, metadata, and experiment details. |
Experimental Protocol: Determining a Protein-Ligand Complex via X-Ray Crystallography
Objective: Solve the high-resolution 3D structure of a target protein bound to a small-molecule inhibitor for structure-based drug design.
Methodology:
- Protein Expression & Purification: Express recombinant protein with affinity tag (e.g., His-tag) in HEK293 or insect cells. Purify via affinity, ion-exchange, and size-exclusion chromatography (SEC). Assess purity (>95%) by SDS-PAGE.
- Crystallization: Mix purified protein (10-20 mg/mL) with ligand at 5:1 molar ratio. Use sitting-drop vapor diffusion in 96-well plates. Screen commercial sparse-matrix screens (e.g., Hampton Research). Optimize hit conditions.
- Cryo-Protection & Harvesting: Soak crystal in mother liquor containing 20-25% cryoprotectant (e.g., glycerol). Flash-cool in liquid nitrogen.
- Data Collection: Mount crystal on synchrotron beamline. Collect diffraction dataset (180-360 images, 0.5-1° oscillation). Aim for resolution <2.5 Å.
- Structure Solution: a. Processing: Index, integrate, and scale images with XDS or autoPROC. b. Phasing: Perform molecular replacement using a homologous structure (PHASER). c. Model Building & Refinement: Iteratively build model in Coot and refine with phenix.refine (minimizing R-work/R-free).
Visualization: Protein Crystallography Workflow
Diagram Title: Protein-Ligand Complex Structure Determination
The Scientist's Toolkit: Protein Structural Biology Reagents
Table 4: Essential Reagents for Protein Structure Determination
| Reagent / Kit | Vendor Examples | Function |
|---|---|---|
| Expression Vector | pcDNA3.4, pFastBac | Plasmid for high-yield recombinant protein expression in mammalian/insect cells. |
| Affinity Purification Resin | Ni-NTA Agarose, Anti-FLAG M2 Affinity Gel | Captures tagged protein from cell lysate with high specificity. |
| Size-Exclusion Chromatography (SEC) Column | Superdex 200 Increase, ENrich SEC | Final polishing step to isolate monodisperse, homogeneous protein. |
| Crystallization Screen Kits | Hampton Research Index, JCSG Core | Pre-formulated solutions to identify initial crystallization conditions. |
| Cryoprotectant | Glycerol, Ethylene Glycol | Prevents ice crystal formation during flash-cooling for data collection. |
Clinical Trial Data
Clinical trial data is the cornerstone of regulatory decision-making, providing controlled, longitudinal evidence of a therapy's safety and efficacy.
Key Quantitative Metrics & Standards
Table 5: Core Clinical Trial Data Standards & Scales
| Standard/Scale | Description | Application |
|---|---|---|
| Clinical Data Interchange Standards Consortium (CDISC) | Global standards for clinical data (SDTM, ADaM). | Mandatory for FDA/EMA submissions. |
| Standardized MedDRA Queries (SMQs) | Groupings of MedDRA terms for adverse event monitoring. | Systematic safety analysis. |
| RECIST 1.1 | Standard for measuring tumor response in solid tumor trials. | Primary efficacy endpoint in oncology. |
| Sample Size | Number of participants needed for statistical power. | Phase 3: Hundreds to thousands. |
Experimental Protocol: Designing a Phase III Randomized Controlled Trial (RCT)
Objective: Compare the efficacy and safety of a novel investigational drug versus standard of care in a defined patient population.
Methodology:
- Protocol & Endpoints: Define primary efficacy endpoint (e.g., Progression-Free Survival), key secondary endpoints (Overall Response Rate, Quality of Life), and safety outcomes.
- Randomization & Blinding: Use interactive web response system (IWRS) to randomize patients 1:1 to treatment arms. Implement double-blinding (patient, investigator).
- Data Collection: Capture data via electronic data capture (EDC) systems. Forms include demographics, medical history, concomitant medications, lab results, efficacy assessments per schedule.
- Monitoring & Management: Conduct regular site monitoring visits. Hold blinded interim analyses by independent Data Monitoring Committee (DMC) for safety.
- Statistical Analysis Plan (SAP): Pre-specify all analyses. For primary endpoint, use Kaplan-Meier method and log-rank test. Analyze safety in treated population.
Visualization: Phase III RCT Data Flow & Analysis
Diagram Title: Phase III Clinical Trial Data Pipeline
The Scientist's Toolkit: Clinical Trial Execution Essentials
Table 6: Key Solutions for Clinical Trial Data Management
| Solution / System | Vendor Examples | Function |
|---|---|---|
| Electronic Data Capture (EDC) | Medidata Rave, Oracle Clinical | Centralized platform for electronic case report form (eCRF) data entry and management. |
| Interactive Web Response System (IWRS) | endpoint Clinical, YPrime | Manages patient randomization and drug supply inventory across trial sites. |
| Clinical Trial Management System (CTMS) | Veeva Vault CTMS, Medidata CTMS | Tracks operational aspects: site management, monitoring visits, documents. |
| Medical Dictionary (MedDRA) | MSSO MedDRA | Standardized medical terminology for coding adverse events and medications. |
| Statistical Analysis Software | SAS, R | Validated environment for executing the Statistical Analysis Plan (SAP). |
Real-World Evidence (RWE)
RWE is clinical evidence derived from analysis of Real-World Data (RWD) on patient health status and care delivery outside of traditional RCTs.
Table 7: Core RWE Data Sources & Study Types
| Source / Study Type | Description | Common Scale/Use Case |
|---|---|---|
| Electronic Health Records (EHR) | Digital patient records from hospitals/clinics. | Longitudinal data for outcomes research, patient journey mapping. |
| Claims & Billing Data | Data from insurance providers (e.g., Medicare). | Large populations for epidemiology, treatment patterns, healthcare utilization. |
| Registries | Disease-specific, prospective observational studies. | Long-term safety and effectiveness in defined populations. |
| External Control Arm (ECA) | RWD-derived control group for single-arm trials. | Provides historical/comparative context for new therapies. |
Experimental Protocol: Generating RWE via an EHR-Based Retrospective Cohort Study
Objective: Compare the time to next treatment (TTNT) for two different oncology regimens in a metastatic cancer population using de-identified EHR data.
Methodology:
- Data Extraction & Linkage: Extract structured data (diagnoses [ICD-10], drugs [RxNorm], labs [LOINC]) from EHR systems (e.g., Epic, Cerner). Link via de-identified patient token.
- Cohort Definition: Define index date (first prescription of Regimen A or B). Apply inclusion/exclusion criteria (metastatic diagnosis, ≥18 years, no prior line). Use propensity score matching (PSM) to balance cohorts on age, sex, comorbidities.
- Outcome & Variable Definition: Primary outcome: TTNT, defined as days from index to start of subsequent systemic therapy or death. Censor at last known encounter.
- Data Curation & Transformation: Curate extracted data to OMOP Common Data Model. Handle missing data via multiple imputation if applicable.
- Statistical Analysis: Perform Kaplan-Meier analysis for TTNT. Use Cox proportional hazards model, adjusted for residual confounders post-PSM, to generate hazard ratio (HR) with 95% confidence interval.
Visualization: RWE Generation from EHR Data
Diagram Title: Real-World Evidence Generation Pipeline
The Scientist's Toolkit: RWE Analytics Essentials
Table 8: Key Tools for Real-World Data Analysis
| Tool / Model | Platform Examples | Function |
|---|---|---|
| Observational Medical Outcomes Partnership (OMOP) CDM | OHDSI ATLAS, Google Health OMOP | Common data model standardizing disparate RWD sources for large-scale analytics. |
| De-Identification Engine | Privacy Analytics RISK, Microsoft Presidio | Scrubs protected health information (PHI) from datasets to enable research. |
| Propensity Score Matching (PSM) Algorithm | R MatchIt, Python scikit-learn |
Reduces confounding in observational studies by creating balanced cohorts. |
| Terminology Mappers | UMLS Metathesaurus, OHDSI Usagi | Maps local codes (ICD-10) to standard vocabularies within a CDM. |
| Federated Analysis Network | TriNetX, Flatiron Health Research Network | Enables distributed querying and analysis across multiple RWD partners without data movement. |
Synthesis: The Converged AI-Biotech Data Architecture
The thesis of AI-biotech convergence is operationalized through an integrated data architecture where these four data types interact. Genomic and protein structural data feed AI models for in silico target discovery and drug design. The resulting candidates are tested in trials, generating clinical data. RWE then extends and contextualizes trial findings in broader populations. AI models are trained and refined across this entire continuum, creating a closed-loop system for accelerated innovation. Mastery of these essential data types—their generation, standards, and integration—is the foundational competence for the next era of biotechnology.
This whitepaper, framed within a broader thesis on AI and biotechnology convergence, provides an in-depth technical analysis of the key organizations advancing AI-driven drug discovery and development. The integration of machine learning, computational biology, and high-throughput experimentation is reshaping traditional R&D pipelines, demanding a new understanding of the collaborative and competitive landscape among established pharmaceutical corporations, agile biotech startups, and foundational technology providers.
The following tables summarize the current investment, partnership, and pipeline scope of major players, based on recent data.
Table 1: Leading Pharmaceutical Companies: AI Initiatives & Key Partnerships (2023-2024)
| Company | AI R&D Investment (Est.) | Primary AI Focus Area | Key AI Partner(s) | Notable Pipeline Asset (Phase) |
|---|---|---|---|---|
| Pfizer | $200-250M annually | Target ID, Clinical Trial Optimization | CytoReason, Tempus | Immunology programs (Preclinical) |
| Merck & Co. | $300M+ annually | Drug Design, Biomarker Discovery | Absci, Iktos | Oncology candidate (Phase I) |
| Novartis | $150-200M annually | Generative Chemistry, Imaging Analytics | Microsoft, BenevolentAI | Heart failure drug (Phase II) |
| AstraZeneca | ~$180M annually | Genomics, Precision Medicine | Illumina, BenevolentAI | Chronic kidney disease (Phase II) |
| Johnson & Johnson | $250M+ annually | Compound Screening, Disease Subtyping | Janssen AI Labs, Atomwise | Alzheimer's biomarker program (Discovery) |
Table 2: Select Publicly Traded AI-Native Biotech Startups
| Company (Ticker) | Market Cap (Approx.) | Core Technology Platform | Lead Therapeutic Area | Key Pharma Collaborator |
|---|---|---|---|---|
| Recursion (RXRX) | ~$2.1B | Phenotypic Screening with CNN | Fibrosis, Oncology | Bayer, Roche/Genentech |
| Exscientia (EXAI) | ~$600M | Centaur Chemist AI Design | Immunology, Oncology | Sanofi, Bristol-Myers Squibb |
| Schrödinger (SDGR) | ~$1.8B | Physics-Based & ML Computational Platform | Oncology, Immunology | Bayer, Takeda |
| AbCellera (ABCL) | ~$1.5B | AI-Powered Antibody Discovery | Immunology, Infectious Disease | Lilly, Novartis |
| Relay Therapeutics (RLAY) | ~$1.9B | Computational Allostery, Dynamics | Oncology | Roche/Genentech |
Table 3: Technology Giants: Cloud & AI Platforms for Life Sciences
| Company | Primary Service Offering | Key Life Sciences Tool/Platform | Example Pharma Client Use Case |
|---|---|---|---|
| Google/ Alphabet | AI Algorithms, Cloud, Quantum | AlphaFold, Vertex AI, Terra | Pfizer: utilizing AlphaFold for target structure prediction. |
| Microsoft | Cloud, ML, Quantum | Azure Quantum Elements, Azure Health | Novartis: AI-powered drug design collaboration. |
| Amazon Web Services | Cloud HPC, ML Services | AWS HealthOmics, SageMaker | Moderna: scaling mRNA sequence design & analysis. |
| NVIDIA | Hardware, AI Software | Clara Discovery, BioNeMo, DGX Cloud | Recursion: powering phenotypic image analysis. |
| IBM | Hybrid Cloud, Quantum | watsonx, IBM Quantum | Cleveland Clinic: jointly running Discovery Accelerator. |
Technical Deep Dive: An AI-Enhanced Drug Discovery Workflow
A representative experimental protocol integrating technologies from across the ecosystem is detailed below.
Experimental Protocol: AI-Guided Hit Identification and Optimization
Objective: To identify and optimize a novel small-molecule inhibitor for a defined protein target using a closed-loop, AI-driven design-make-test-analyze (DMTA) cycle.
Methodology:
Phase 1: In-silico Library Design & Virtual Screening
- Target Preparation: Obtain a 3D structure of the target protein (experimental from PDB or predicted via AlphaFold2). Prepare the structure using molecular modeling software (e.g., Schrödinger's Protein Preparation Wizard) for proper protonation states and missing loop modeling.
- Generative Library Design: Use a generative chemical AI model (e.g., Exscientia's Centaur Chemist, Iktos' Makya) to propose novel compounds. The model is conditioned on:
- Known active ligands (from public ChEMBL data or internal assays).
- Calculated molecular descriptors (QED, SAscore).
- In-silico docking scores against the prepared target (using Glide, AutoDock Vina).
- Multi-Parameter Optimization (MPO): A scoring function ranks generated molecules based on a weighted sum of predicted properties: potency (docking score), synthetic accessibility (SAscore), predicted ADMET (from a model like AstraZeneca's AZOrange), and novelty (distance in chemical space from known actives).
- Compound Selection: The top 200-500 ranked virtual compounds are selected for synthesis.
Phase 2: Synthesis & Biological Testing (The Experimental "Make-Test" Loop)
- Automated Synthesis: Selected compounds are synthesized using automated, high-throughput platforms (e.g., flow chemistry systems from Merck Millipore or Chempeed).
- Primary Biochemical Assay: Purified compounds are tested in a target inhibition assay (e.g., time-resolved fluorescence energy transfer (TR-FRET) assay).
- Reagent Solutions:
- Recombinant Target Protein: Purified, tagged protein expressed in HEK293 or Sf9 cells.
- TR-FRET Substrate Pair: Europium (Eu)-cryptate-labeled antibody (donor) and d2-labeled substrate (acceptor).
- Assay Buffer: Optimized pH and ionic strength buffer (e.g., HEPES, NaCl, MgCl2, BSA).
- Positive/Negative Controls: Known high-potency inhibitor and DMSO-only wells.
- Protocol: In a 384-well plate, combine 2nL of compound (via acoustic dispensing), 5µL of target protein, and 5µL of substrate mix. Incubate for 60 min at RT. Read on a plate reader (e.g., PerkinElmer EnVision) using 340nm excitation, 615nm (Eu) and 665nm (d2) emission. Calculate inhibition % and IC50 via dose-response curves.
- Reagent Solutions:
- Cellular Phenotypic Assay: Compounds with IC50 < 1µM progress to a cell-based assay (e.g., oncology cell line viability assay using CTG).
- Protocol: Seed cells in 1536-well plates. Dose compounds via pintool transfer. Incubate for 72-96h. Add CellTiter-Glo reagent, incubate 10 min, measure luminescence. Determine cell viability %.
Phase 3: Data Analysis & Model Retraining (The "Analyze" Step)
- Data Aggregation: Biochemical IC50, cellular EC50, and compound structural data (SMILES) are aggregated into a centralized data lake (e.g., on AWS S3 or Google Cloud Storage).
- Model Retraining: The generative AI model from Phase 1 is retrained/fine-tuned on the new experimental data using a transfer learning approach. This creates an updated model that has "learned" from the last design cycle.
- Next-Generation Design: The retrained model generates a new set of proposed compounds, ideally with improved predicted potency and cellular activity, initiating the next DMTA cycle. The process iterates until a lead series with desired in-vitro and early in-vivo PK/PD profiles is identified.
Visualizing the Ecosystem & Workflow
Diagram 1: AI Drug Discovery Ecosystem Map
Diagram 2: Closed-Loop AI-Driven DMTA Cycle
The Scientist's Toolkit: Key Research Reagent Solutions
Table 4: Essential Reagents for AI-Validated Biochemical & Cellular Assays
| Item | Function in Protocol | Example Vendor/Product |
|---|---|---|
| Tagged Recombinant Protein | The purified target for biochemical assays; tags enable immobilization or detection. | Sino Biological, Thermo Fisher Gibco. |
| TR-FRET Assay Kits | Homogeneous, high-sensitivity assay format for quantifying enzymatic activity or binding. | Cisbio, PerkinElmer. |
| CellTiter-Glo 3D | Luminescent assay for quantifying viable cells in 2D or 3D cultures post-treatment. | Promega. |
| Acoustic Dispensing-Compatible Plates | Low-volume, high-density microplates for non-contact compound addition. | Labcyte Echo-qualified plates. |
| DMSO-Compatible Compound Libraries | Pre-formatted, solubilized small molecules for high-throughput screening. | Enamine, Merck Sigma-Aldrich LOPAC. |
| Cloud-Based ELN/LIMS | Electronic Lab Notebook and Laboratory Information Management System for structured data capture. | Benchling, IDBS. |
The convergence of AI and biotechnology is being driven by a synergistic ecosystem where tech giants provide the foundational compute and algorithms, AI-native biotechts innovate on rapid iterative design, and large pharmaceutical companies contribute deep biological expertise, scaled development capabilities, and routes to commercialization. The technical workflow outlined—a closed-loop, data-hungry DMTA cycle—is becoming the new standard, demanding robust experimental protocols and seamless data integration. Success in this field will depend on strategic navigation of this complex and collaborative landscape.
Building the Future: Key AI Methodologies and Their Transformative Biotech Applications
The convergence of artificial intelligence and biotechnology represents a paradigm shift in molecular science. This whitepaper, framed within a broader thesis on this convergence, details how generative AI models are transitioning from predictive tools to creative engines for de novo molecular design. Technologies like AlphaFold3 and diffusion models are no longer merely analyzing biological data; they are synthesizing novel, functional molecular constructs, thereby accelerating drug discovery and protein engineering from years to months.
Foundational Technologies & Quantitative Benchmarks
Protein Structure Prediction & Generation: AlphaFold Evolution
AlphaFold3, released by Google DeepMind and Isomorphic Labs in May 2024, generalizes beyond monomeric protein folding to a unified predictive and generative platform for biomolecular complexes.
Table 1: Performance Benchmark of AlphaFold Versions & Contemporaries
| Model (Release Year) | Scope | Average TM-score (vs. Experimental) | Key Capability | Experimental Validation (RMSD Å) |
|---|---|---|---|---|
| AlphaFold2 (2020) | Protein monomers | ~0.88 (CASP14) | Static structure prediction | 1.0-1.5 |
| RoseTTAFold2 (2023) | Proteins, complexes | ~0.86 | Protein-protein complexes | 1.5-2.5 |
| AlphaFold3 (2024) | Proteins, DNA, RNA, ligands, PTMs | >0.7 on complexes | Generative design of complexes | < 2.0 on ligands |
| RFdiffusion (2023) | De novo protein design | N/A (design metric) | Generates novel protein backbones | High success in in vitro folding |
Experimental Protocol for AlphaFold3 Validation:
- Input Preparation: Assemble sequences (protein, DNA, RNA) and ligand SMILES strings.
- Model Inference: Run the AlphaFold3 server or local implementation with default multiple sequence alignment (MSA) and structural template searches disabled for ab initio mode.
- Output Generation: The model outputs a predicted atomic point cloud with per-residue and per-atom confidence metrics (pLDDT, pTM, ipTM).
- Experimental Ground-Truth Comparison: The predicted structure is aligned to an experimentally solved structure (e.g., via X-ray crystallography) using CEAlign or TM-align algorithms.
- Metric Calculation: Root-mean-square deviation (RMSD) for heavy atoms and Template Modeling Score (TM-score) are computed. A TM-score >0.5 indicates correct topology.
Diffusion Models for Molecular Generation
Diffusion models learn to generate molecular structures by iteratively denoising from random noise. They operate in discrete (graph-based) or continuous (3D coordinate) spaces.
Table 2: Key Generative AI Models for Molecular Design
| Model Name | Type | Molecular Space | Key Application | Success Rate (Experimental) |
|---|---|---|---|---|
| RFdiffusion | Diffusion | 3D Backbone Coordinates | Symmetric protein assemblies, binders | ~20% high-affinity binders |
| Chroma | Diffusion | 3D Coordinates + Chemical | Proteins with functional sites | Validated for enzyme design |
| DiffDock | Diffusion | Ligand Pose (SE(3)) | Molecular docking | >30% top-1 accuracy (<2Å RMSD) |
| PoET | Auto-regressive | Amino Acid Sequence | Protein language model for design | High expression/folding rates |
Experimental Protocol for Diffusion-based Protein Design (e.g., RFdiffusion):
- Specify Design Goal: Define a structural motif, symmetric repeat, or binding site contour via a "guidance" function.
- Noise Initialization: Start with a cloud of Cα atoms (backbone) initialized as random noise or a simple scaffold.
- Denoising Process: Apply the trained diffusion model for 50-200 steps. At each step, the model predicts the denoised structure, guided towards the desired functional characteristic.
- Sequence Design: Pass the generated backbone to a inverse folding model (e.g., ProteinMPNN) to predict an optimal amino acid sequence that stabilizes the structure.
- In Silico Validation: Use RosettaFold or AlphaFold2 to "fold" the designed sequence and verify structural fidelity to the generated blueprint (predicted Aligned Error < 5Å).
Integrated Workflow forDe NovoDrug Creation
The modern generative pipeline integrates multiple AI modules.
Diagram 1: Generative AI Drug Discovery Pipeline (92 chars)
Key Signaling Pathways in Targeted Drug Design
Generative models often aim to modulate specific disease-relevant pathways.
Diagram 2: PI3K-AKT-mTOR Pathway & AI Inhibition (87 chars)
The Scientist's Toolkit: Research Reagent Solutions
Table 3: Essential Materials for Validating AI-Designed Molecules
| Item | Function in Validation | Example Product/Catalog |
|---|---|---|
| HEK293T Cells | Protein expression platform for testing designed proteins or expressing target receptors. | ATCC CRL-3216 |
| Surface Plasmon Resonance (SPR) Chip | Label-free kinetic analysis of binding affinity (KD) between AI-designed molecule and purified target. | Cytiva Series S Sensor Chip CMS |
| Cryo-EM Grids | High-resolution structural validation of designed protein complexes. | Quantifoil R1.2/1.3 300 mesh Au |
| Kinase Assay Kit | Functional enzymatic activity assay for inhibitors targeting kinase pathways (e.g., PI3K-AKT). | ADP-Glo Kinase Assay (Promega) |
| Phospho-Specific Antibody Panel | Western blot analysis of pathway modulation (e.g., p-AKT, p-S6) by designed therapeutics. | Cell Signaling Technology #4060 |
| Size Exclusion Chromatography Column | Purification and assessment of monodispersity for de novo designed proteins. | Superdex 200 Increase 10/300 GL (Cytiva) |
The integration of generative AI models like AlphaFold3 and diffusion networks is establishing a new foundation for molecular design. This technical guide outlines the core methodologies and validation frameworks underpinning this shift. As the AI-biotechnology convergence deepens, the iterative loop between in silico generation and high-throughput experimental validation will become increasingly automated, driving the creation of previously unimaginable therapeutic modalities and functional biomaterials.
This whitepaper, framed within a broader thesis on AI and biotechnology convergence, details the application of deep learning (DL) to the critical pharmaceutical challenges of target identification and validation. The integration of multi-omics (genomics, transcriptomics, proteomics, metabolomics) and high-content phenotypic data presents both an unprecedented opportunity and a significant analytical hurdle. DL architectures are uniquely suited to decipher the complex, non-linear relationships within these high-dimensional datasets, accelerating the discovery of novel, druggable targets and predicting their biological and clinical relevance.
Core Deep Learning Architectures in Multi-Omics Analysis
Data Integration and Representation Learning
A primary challenge is the heterogeneous nature of multi-omics data. DL models like Multi-modal Autoencoders (MMAE) and Cross-modal Attentive Networks learn unified latent representations from disparate data types.
Protocol: Training a Stacked Denoising Multi-modal Autoencoder
- Data Preprocessing: Independently normalize each omics dataset (e.g., Z-score for RNA-seq, min-max for methylation data). Introduce stochastic noise (e.g., Gaussian noise, random masking) to input features.
- Model Architecture: Construct separate encoder networks for each omics modality. Each encoder consists of 3 fully connected layers with decreasing neurons (e.g., 1024 → 512 → 256), ReLU activation, and batch normalization. The outputs of each modality's encoder are concatenated into a joint latent vector (e.g., 128 dimensions).
- Training: A single decoder network (mirroring encoder architecture) reconstructs the denoised input for all modalities from the latent vector. Use a composite loss function:
L_total = L_reconstruction + λ * L_contrastive, whereL_reconstructionis Mean Squared Error for continuous data and Binary Cross-Entropy for discrete data, andL_contrastiveensures similar samples have similar latent codes. - Output: The trained latent space is used for downstream tasks like clustering patient subtypes or predicting drug response.
Target Identification via Graph Neural Networks (GNNs)
Biological systems are inherently graph-structured (e.g., protein-protein interaction (PPI) networks, gene regulatory networks). GNNs, particularly Graph Convolutional Networks (GCNs) and Graph Attention Networks (GATs), propagate information across these networks to identify key disease-associated modules and novel candidate targets.
Protocol: Identifying Novel Targets with a GAT on a PPI Network
- Graph Construction: Build an undirected graph
G = (V, E)where nodesVare proteins and edgesEare known physical interactions from databases like STRING or BioGRID. Initialize node features using gene expression or mutation vectors. - Model Architecture: Implement a 3-layer GAT. Each layer computes attention coefficients between a node and its neighbors, performing weighted message passing. The final layer produces a node embedding.
- Training: Formulate a semi-supervised node classification task. A subset of nodes are labeled as "known disease targets" or "non-targets" based on databases like Open Targets. The model is trained to predict these labels.
- Validation: Rank all unlabeled proteins by their predicted "target" score. Top-ranked candidates are prioritized for in silico validation (e.g., docking studies) and functional assays.
Quantitative Performance of DL Models in Target Discovery
Table 1: Benchmarking DL architectures on public multi-omics datasets for target identification tasks.
| Model Architecture | Dataset (TCGA Study) | Primary Task | Key Metric | Reported Performance | Reference (Example) |
|---|---|---|---|---|---|
| Multi-modal DNN | BRCA (Genome, Transcriptome) | Subtype Classification | AUC-ROC | 0.94 | (Xiao et al., 2021) |
| Graph Convolutional Network | Pan-cancer (PPI + Mut) | Essential Gene Prediction | Average Precision | 0.78 | (Greene et al., 2022) |
| Variational Autoencoder | CCLE (Expr, CNV, Mut) | Drug Response Prediction | Concordance Index | 0.85 | (Rampášek et al., 2022) |
| Transformer Encoder | GTEx + TCGA (Transcriptome) | Novel Driver Gene Discovery | Precision@100 | 0.31 | (Zeng et al., 2023) |
Integrated Experimental & Computational Validation Workflow
A robust DL-driven pipeline requires iterative experimental feedback for validation.
Diagram 1: Iterative DL-driven target identification and validation cycle.
The Scientist's Toolkit: Key Research Reagent Solutions
Table 2: Essential materials and reagents for experimental validation of DL-predicted targets.
| Category / Item | Example Product/Technology | Primary Function in Validation |
|---|---|---|
| Gene Modulation | CRISPR-Cas9 knockout/activation kits (e.g., Synthego, IDT) | Functional validation of target necessity and sufficiency in disease-relevant cellular phenotypes. |
| Phenotypic Screening | High-content screening (HCS) systems (e.g., PerkinElmer Operetta, Celigo) | Quantifying complex morphological changes (cell death, organelle health) post-target modulation. |
| Protein Analysis | Multiplex immunoassays (e.g., Olink, MSD) | Measuring target protein expression and downstream pathway activation in patient samples or models. |
| Cell Models | Induced pluripotent stem cell (iPSC)-derived cells or patient-derived organoids (PDOs) | Testing target relevance in physiologically relevant, patient-specific genetic backgrounds. |
| In Vivo Models | Patient-derived xenograft (PDX) mice or humanized mouse models | Evaluating target efficacy and safety in a complex, systemic environment. |
| Data Integration | Cloud-based bioinformatics platforms (e.g., DNAnexus, Terra) | Managing and analyzing the multi-omics and phenotypic data generated during validation. |
Detailed Experimental Validation Protocol
Protocol: High-Content Phenotypic Validation of a Novel Kinase Target This protocol follows the in vitro validation step in Diagram 1.
Cell Line Engineering:
- Select a disease-relevant cell line (e.g., a cancer cell line with the target pathway active).
- Using a lentiviral system, create three stable polyclonal populations: a) Non-targeting shRNA control, b) shRNA against the novel kinase target, c) Overexpression of the wild-type kinase.
- Confirm modulation via qPCR and western blot.
High-Content Screening Assay Setup:
- Seed engineered cells in 384-well imaging plates. For knockout lines, include a titration of a known standard-of-care therapeutic as a control.
- At 72 hours post-seeding, stain cells with a multiplex dye set: Hoechst 33342 (nuclei, 350/461 nm), MitoTracker Deep Red (mitochondria, 644/665 nm), Annexin V Alexa Fluor 488 (apoptosis, 495/519 nm), and CellEvent Caspase-3/7 reagent (apoptosis, 502/530 nm).
- Fix cells and image using a 20x objective on a high-content imager (e.g., ImageXpress Micro Confocal).
Image and Data Analysis:
- Use onboard software (e.g., MetaXpress) to segment cells and quantify >500 features per cell: morphological (size, shape), intensity-based (marker fluorescence), and textual features.
- Export single-cell data. Apply a DL-based image analysis tool (e.g., a convolutional autoencoder) to extract latent morphological features not captured by traditional analysis.
- Perform statistical analysis (e.g., ANOVA) to compare populations. A successful target knockdown should mimic the phenotypic signature of the therapeutic control or show a specific phenotype (e.g., increased apoptosis, loss of mitochondrial membrane potential).
Diagram 2: High-content phenotypic validation workflow for a novel target.
The convergence of deep learning and biotechnology is transforming target identification from a hypothesis-limited to a data-driven discipline. By effectively mining multi-omics and phenotypic landscapes, DL models generate high-probability candidate targets. However, their true value is realized only within an iterative, closed-loop framework where computational predictions are rigorously tested with modern experimental toolkits. This virtuous cycle of prediction and validation, as outlined in this guide, is accelerating the development of novel therapeutics and is a cornerstone of next-generation biopharmaceutical research.
This whitepaper, framed within a broader thesis on AI and biotechnology convergence, provides a technical guide to the application of artificial intelligence (AI) and machine learning (ML) for predicting clinical trial outcomes, toxicity, and pharmacokinetic/pharmacodynamic (PK/PD) properties. The convergence of high-dimensional biological data and advanced computational methods is transforming drug development by enabling in silico hypothesis generation and de-risking candidates prior to costly human trials.
Algorithmic Approaches
AI-driven predictive modeling employs a spectrum of algorithms, each suited to specific data types and prediction tasks.
Table 1: Core AI/ML Algorithms in Predictive Drug Development
| Algorithm Class | Example Models | Primary Application | Key Advantage |
|---|---|---|---|
| Tree-Based Ensembles | Random Forest, XGBoost, LightGBM | Binary outcome prediction (e.g., toxicity yes/no), feature importance. | Handles mixed data types, robust to non-linear relationships. |
| Deep Learning (DL) | Multilayer Perceptrons (MLPs), Convolutional Neural Networks (CNNs), Graph Neural Networks (GNNs) | PK parameter prediction, molecular property regression, omics data integration. | Captures complex, high-order interactions in unstructured data. |
| Natural Language Processing (NLP) | Transformer Models (BERT, BioBERT) | Mining Electronic Health Records (EHRs) for adverse event signals, literature-based discovery. | Extracts latent knowledge from unstructured text corpora. |
| Bayesian Methods | Bayesian Neural Networks, Gaussian Processes | PK/PD modeling with uncertainty quantification, dose optimization. | Provides probabilistic predictions and credible intervals. |
Key Data Modalities
Model performance is intrinsically linked to data quality and diversity. Primary data sources include:
- Chemical & Structural Data: SMILES strings, molecular fingerprints, 3D conformations.
- Omics Data: Genomics (GWAS, sequencing), transcriptomics, proteomics, metabolomics.
- Clinical Trial Data: Participant-level data on demographics, efficacy endpoints, adverse events (AEs), and lab values.
- Real-World Data (RWD): EHRs, medical claims, patient registries, pharmacovigilance databases (e.g., FDA Adverse Event Reporting System - FAERS).
- Literature & Patents: Large textual corpora for knowledge graph construction.
Experimental Protocols for Key Applications
Protocol: Predicting Phase III Trial Success from Multi-Omics and Early Clinical Data
Objective: To build a classifier that predicts the probability of Phase III trial success (positive primary endpoint) using data available at the end of Phase II.
Materials & Workflow:
- Data Curation: Assemble a labeled dataset of historical drug programs. Features include: target pathway enrichment scores (from transcriptomics), genetic polymorphism profiles of trial populations (pharmacogenomics), aggregate safety profiles from Phase II (frequency of Grade ≥3 AEs), and compound properties (e.g., lipophilicity, polar surface area).
- Feature Engineering: Normalize omics data (z-score). Encode categorical variables (e.g., therapeutic area) using one-hot encoding. Perform principal component analysis (PCA) on high-dimensional omics features to reduce dimensionality.
- Model Training: Use a stacked ensemble model. First-level models include XGBoost, a 1D-CNN for omics data, and an MLP. A logistic regression model serves as the meta-learner, taking the predictions from the first-level models as input.
- Validation: Perform temporal validation (train on data before a specific year, test on subsequent years) to avoid data leakage and simulate real-world forecasting. Evaluate using AUC-ROC, precision-recall curves, and calibration plots.
Protocol: In Silico Prediction of Organ-Specific Toxicity (e.g., Cardiotoxicity)
Objective: To predict the risk of drug-induced cardiotoxicity (e.g., prolonged QT interval, cardiomyopathy) from chemical structure and in vitro assay data.
Materials & Workflow:
- Data Source: Utilize public datasets like the FDA's Comprehensive in Vitro Proarrhythmia Assay (CIPA) initiative data and Tox21.
- Molecular Representation: Convert chemical structures to Morgan fingerprints (radius 2, 2048 bits) and pre-trained molecular embeddings (e.g., from ChemBERTa).
- Model Architecture: Implement a Graph Neural Network (GNN) that operates directly on the molecular graph, followed by a multi-task learning head.
- Training: The GNN is trained to simultaneously predict: a) inhibition of the hERG ion channel (primary endpoint), b) cytotoxicity in human cardiomyocyte cell lines, and c) transcriptional stress response profiles from Cell Painting assays. This multi-task approach improves generalizability.
- Output: A risk score (0-1) and a list of analogous compounds with known clinical toxicity profiles.
Title: AI Workflow for Cardiotoxicity Prediction
Protocol: AI-Enhanced Population PK/PD Modeling
Objective: To generate virtual patient populations and predict inter-individual variability in drug exposure and response.
Materials & Workflow:
- Base Model: Start with a traditional non-linear mixed-effects (NLME) model describing the PK/PD relationship (e.g., two-compartment PK with an Emax PD model).
- Covariate Discovery: Instead of pre-specified covariate testing, use a Random Forest or Gradient Boosting model to identify complex, non-linear relationships between patient features (genetic variants, renal/liver function markers, age, weight) and the NLME model's individual random effects (e.g., on clearance, volume).
- Neural ODEs: Implement a neural ordinary differential equation (Neural ODE) framework as a complementary approach. The neural network learns the derivatives of the system dynamics directly from rich, time-series PK/PD data, potentially uncovering unmodeled biological processes.
- Virtual Population Simulation: Sample from real-world demographic and genomic distributions to create a virtual cohort of 10,000 patients. Use the AI-enhanced model to simulate drug concentration-time profiles and predicted effect for each virtual patient, identifying subpopulations at risk of under-dosing or toxicity.
Title: AI-Enhanced PK/PD Modeling & Simulation
The Scientist's Toolkit: Research Reagent Solutions
Table 2: Essential Reagents & Tools for AI-Driven Predictive Assays
| Item / Solution | Function in AI Model Development | Example Vendor/Resource |
|---|---|---|
| High-Content Screening (HCS) Kits | Generate multiparametric cellular morphology data (Cell Painting) for training phenotypic toxicity predictors. | Revvity (formerly PerkinElmer), Thermo Fisher Scientific |
| hERG Inhibition Assay Kits | Provide standardized in vitro data for a key cardiotoxicity endpoint to train and validate predictive models. | Eurofins Discovery, Charles River Laboratories |
| Recombinant CYP450 Enzymes | Generate data on metabolic stability and drug-drug interaction potential for PK prediction models. | Corning, Sigma-Aldrich |
| Patient-Derived Organoid (PDO) Systems | Create clinically relevant in vitro response data to train models on heterogeneous patient populations. | STEMCELL Technologies, Organoid Therapeutics |
| Public Data Repositories | Source of labeled data for model training and benchmarking. | ChEMBL, DrugBank, CIPA Portal, TCGA, FDA OpenFDA portal |
Quantitative Performance Benchmarks
Table 3: Reported Performance of AI Models in Recent Studies (2023-2024)
| Prediction Task | Data Used | Model Type | Reported Performance | Key Limitation |
|---|---|---|---|---|
| Phase III Outcome | 612 trials, multi-omics, early clinical | Stacked Ensemble (XGBoost + MLP) | AUC: 0.82; Precision: 76% (for positive predictions) | Retrospective cohort; potential historical bias. |
| Drug-Induced Liver Injury (DILI) | ~1,200 compounds, chemical & bioactivity | Graph Attention Network (GAT) | AUC: 0.89; Sensitivity: 81% | Relies on structural analogs with known labels. |
| Human Clearance (PK) | 1,085 small molecules, in vitro assay data | Hybrid CNN & Gradient Boosting | Mean Absolute Error (MAE): 0.22 log mL/min/kg | Poor extrapolation to novel chemical scaffolds. |
| Optimal First-in-Human Dose | Phase I clinical data, preclinical PK/PD | Bayesian Optimization + NLME | Prediction within 2-fold of actual dose: 92% of cases | Requires high-quality preclinical PK/PD linkage. |
AI-powered predictive modeling represents a cornerstone of the biotech-AI convergence, offering a paradigm shift from reactive to proactive drug development. By systematically integrating diverse data streams through sophisticated algorithms, these models illuminate hidden patterns governing clinical outcomes, toxicity, and PK/PD. While challenges remain—including data quality, model interpretability, and regulatory acceptance—the continued refinement of protocols and toolkits promises to enhance the precision, efficiency, and success rate of bringing new therapies to patients.
This technical guide, framed within the broader thesis of AI and biotechnology convergence, details the application of advanced computer vision (CV) in two pivotal biotech domains: High-Content Screening (HCS) and histopathology analysis. The integration of deep learning with high-throughput imaging and digitized tissue slides is accelerating drug discovery and precision diagnostics by extracting quantitative, high-dimensional data from complex biological images.
The convergence of artificial intelligence (AI) and biotechnology is revolutionizing how we interrogate biological systems. At the intersection lies computer vision, enabling the automated, quantitative, and unbiased analysis of microscopic images. This guide provides an in-depth examination of core methodologies in HCS for drug discovery and computational pathology for clinical and research applications.
High-Content Screening (HCS) with Computer Vision
HCS combines automated microscopy with multiplexed staining and automated image analysis to analyze cellular phenotypes and compound effects.
Core Experimental Protocol: Multiparametric Phenotypic Profiling
A standard protocol for assessing compound toxicity and mechanism of action is outlined below.
1. Cell Seeding & Treatment:
- Seed appropriate cell lines (e.g., U2OS, HepG2) in 384-well microplates.
- After 24 hours, treat cells with compound libraries (typically 1-10 µM) and controls (DMSO vehicle, positive control toxins). Incubate for 24-72 hours.
2. Cell Staining & Fixation:
- Fix cells with 4% paraformaldehyde (15 min).
- Permeabilize with 0.1% Triton X-100 (10 min).
- Stain with multiplexed dyes:
- Hoechst 33342 (nuclei, 1 µg/mL).
- Phalloidin-Alexa Fluor 488 (F-actin cytoskeleton).
- MitoTracker Deep Red (mitochondria).
- Wash and seal plates for imaging.
3. Automated Image Acquisition:
- Use a high-content confocal imager (e.g., PerkinElmer Opera Phenix, Yokogawa CV8000).
- Acquire images in 4-6 channels (DAPI, FITC, TRITC, Cy5) at 20x or 40x magnification with z-stacking (optional).
4. Computer Vision Analysis Pipeline:
- Preprocessing: Illumination correction, background subtraction, channel alignment.
- Segmentation: Utilize deep learning models (e.g., U-Net, Cellpose) trained on labeled data to segment individual nuclei and cytoplasm.
- Feature Extraction: For each segmented cell, extract hundreds of morphometric, intensity, and textural features (see Table 1).
- Classification & Profiling: Apply dimensionality reduction (t-SNE, UMAP) and clustering to group compounds by phenotypic signature.
Table 1: Key Quantitative Features Extracted in HCS
| Feature Category | Specific Metrics | Typical Value Range (Control Cells) | Biological Relevance |
|---|---|---|---|
| Nuclear Morphology | Area, Perimeter, Eccentricity, Intensity | 80-120 µm², 0.1-0.3 (Eccentricity) | Apoptosis, cell cycle state |
| Cytoplasmic Texture | Haralick features (Contrast, Correlation) | 0.8-1.2 (Correlation) | Protein aggregation, organelle disruption |
| Intensity Distribution | Total Intensity, Std Dev of Intensity | 50-200 a.u. (MitoTracker) | Mitochondrial mass & membrane potential |
| Spatial Relationships | Distance from nucleus to organelles | 5-15 µm (Nuc-to-Mito) | Cytoskeletal disruption |
Title: High-Content Screening Computer Vision Workflow
Histopathology Analysis with Computational Pathology
Whole Slide Imaging (WSI) digitizes glass pathology slides, enabling AI-driven analysis for diagnosis, prognosis, and biomarker discovery.
Core Experimental Protocol: AI-Assisted Tumor Microenvironment Analysis
A protocol for quantifying tumor-infiltrating lymphocytes (TILs) and PD-L1 expression in non-small cell lung carcinoma (NSCLC).
1. Tissue Processing & Staining:
- Obtain FFPE (Formalin-Fixed, Paraffin-Embedded) tissue sections (4 µm thick).
- Perform automated immunohistochemistry (IHC) for CD8 (T-cell marker) and PD-L1 (immune checkpoint) with hematoxylin counterstain.
2. Whole Slide Imaging & Data Management:
- Scan slides at 40x magnification using a digital slide scanner (e.g., Aperio AT2, Hamamatsu NanoZoomer).
- Save images in pyramidal file formats (e.g., .svs, .ndpi) to manage multi-gigabyte files.
3. Computer Vision Analysis Pipeline:
- Tiling & Patch Extraction: Divide WSI into small, manageable patches (e.g., 256x256 px at 20x equivalent).
- Tissue Detection: Apply a model to exclude background, artifacts, and non-informative tissue.
- Critical Segmentation Tasks:
- Nuclei Segmentation/Classification: Use a HoVer-Net or Mask R-CNN model to segment all nuclei and classify them as Tumor, Lymphocyte, Stromal, or Necrotic.
- PD-L1 Scoring: Segment tumor and immune cells, then classify PD-L1 membrane staining as positive or negative based on validated thresholds (e.g., Tumor Proportion Score).
- Spatial Analysis: Calculate spatial metrics like TIL density at the invasive margin and cell-to-cell proximity.
Table 2: Key Quantitative Metrics in Computational Pathology
| Metric | Calculation Method | Clinical/Research Utility | Typical Benchmark (NSCLC) |
|---|---|---|---|
| Tumor Proportion Score (TPS) | (PD-L1+ Tumor Cells / Total Viable Tumor Cells)*100 | Patient selection for immunotherapy | TPS ≥1% for therapy eligibility |
| TIL Density | # CD8+ Lymphocytes / mm² in tumor stroma | Prognostic biomarker | High TILs correlate with better OS |
| Spatial Co-localization | G-function or Ripley's K analysis | Understanding immune exclusion | |
| Tumor Bud Count | Automated detection of detached tumor cell clusters | Prognostic in colorectal cancer | >10 buds = poor prognosis |
Title: Computational Pathology Analysis Pipeline
The Scientist's Toolkit: Key Research Reagent Solutions
Table 3: Essential Materials for CV-Driven Experiments
| Item | Function & Relevance | Example Products / Models |
|---|---|---|
| Live-Cell Dyes / Biosensors | Enable tracking of dynamic processes (Ca2+ flux, apoptosis). | FLIPR Calcium 6 Assay Kit, Incucyte Caspase-3/7 Dye |
| Multiplex IHC/IF Kits | Allow simultaneous detection of 6+ biomarkers on one tissue/cell sample. | Akoya Biosciences Opal, Standard BioTools Codex |
| High-Content Imagers | Automated microscopes for rapid, multi-well plate imaging. | PerkinElmer Opera Phenix, Molecular Devices ImageXpress |
| Digital Slide Scanners | Create high-resolution whole slide images for AI analysis. | Leica Aperio AT2, Philips Ultra Fast Scanner |
| Annotation Software | Create ground-truth labels to train deep learning models. | Pathologist-in-the-loop platforms (Visopharm, HALO AI) |
| Open-Source CV Libraries | Provide pre-built models and frameworks for custom analysis. | TensorFlow, PyTorch, MONAI, QuPath |
Challenges and Future Directions
Key challenges include the need for large, high-quality, annotated datasets, model interpretability ("black box" problem), and clinical validation for regulatory approval. Future convergence will involve multimodal AI integrating pathology images with genomics (spatial transcriptomics) and electronic health records for holistic biological insight.
This guide underscores that computer vision is not merely an analytical tool but a transformative technology driving the AI-biotech convergence, enabling a new era of data-driven, quantitative biology.
The convergence of artificial intelligence (AI) and biotechnology represents a paradigm shift in therapeutic development. This whitepaper examines three critical therapeutic areas—oncology, neurology, and rare diseases—where this synergy is yielding tangible breakthroughs. By leveraging machine learning (ML) for multi-omic data integration, target discovery, and clinical trial optimization, researchers are accelerating the path from bench to bedside. The following case studies provide an in-depth technical analysis of experimental protocols, data outputs, and the essential toolkit enabling these advances.
Oncology: AI-Driven Biomarker Discovery in Non-Small Cell Lung Cancer (NSCLC)
Background: The identification of predictive biomarkers for immune checkpoint inhibitor (ICI) response remains a central challenge in oncology. Traditional methods like PD-L1 immunohistochemistry show limited specificity.
Case Study: Multi-modal AI for Predicting ICI Response A 2024 study utilized a deep learning model integrating whole-slide histopathology images, RNA-seq data, and clinical variables to predict patient response to pembrolizumab in advanced NSCLC.
Experimental Protocol:
- Cohort & Data Acquisition: Retrospective data from 850 NSCLC patients treated with anti-PD-1 therapy was gathered from The Cancer Genome Atlas (TCGA) and a proprietary clinical trial dataset (NCT03318900). Data types included:
- H&E-stained whole-slide images (WSIs).
- Bulk RNA-seq data (FPKM normalized).
- Clinical variables (age, smoking status, PD-L1 TPS).
- Feature Extraction:
- Histopathology: A pre-trained convolutional neural network (CNN), ResNet50, was used to extract 1024-dimensional feature vectors from tiled image regions.
- Transcriptomics: Top 5,000 variable genes were selected. Pathway enrichment scores (e.g., for IFN-γ response, T-cell infiltration) were calculated using single-sample Gene Set Enrichment Analysis (ssGSEA).
- Model Architecture & Training: A multi-modal neural network with separate encoders for image and RNA data was implemented. The encoders' outputs were concatenated with clinical data and fed into a fully connected classifier. The model was trained using 5-fold cross-validation with a binary cross-entropy loss function (Adam optimizer, learning rate=0.001).
- Validation: Performance was evaluated on a held-out test set (n=170 patients) using objective response rate (ORR) as the primary endpoint.
Quantitative Results:
Table 1: Performance Metrics of Multi-modal AI Model vs. Standard Biomarker (PD-L1 TPS ≥50%)
| Metric | AI Model (AUC) | PD-L1 TPS ≥50% (AUC) | p-value |
|---|---|---|---|
| Overall Response Prediction | 0.89 | 0.67 | <0.001 |
| Progression-Free Survival (PFS) Prediction | 0.82 | 0.62 | <0.005 |
| Sensitivity | 84.1% | 58.2% | - |
| Specificity | 87.6% | 72.4% | - |
Visualization: AI-Driven Biomarker Discovery Workflow
The Scientist's Toolkit: Key Reagents for NSCLC Multi-omic Profiling
| Reagent / Solution | Function in Protocol |
|---|---|
| FFPE Tissue Sections (4-5 µm) | Source material for H&E staining and RNA extraction. |
| RNeasy FFPE Kit (Qiagen) | Isolates high-quality RNA from formalin-fixed, paraffin-embedded tissue. |
| TruSeq RNA Access Library Prep Kit | Prepares targeted RNA-seq libraries from degraded FFPE-derived RNA. |
| Pan-Cytokeratin Antibody (AE1/AE3) | Used for digital pathology tissue segmentation to identify tumor regions. |
| Immune Panel mRNA Signature Assay (NanoString) | Validates gene expression signatures (e.g., T-cell inflamed score) from RNA-seq. |
Neurology: AI in Target Identification for Alzheimer's Disease
Background: Alzheimer's Disease (AD) involves complex pathophysiology. AI enables the integration of genomics and proteomics to deconvolute novel causal pathways.
Case Study: Network Pharmacology for Novel AD Target Discovery A 2023 study applied graph neural networks (GNNs) to human brain proteomic and genetic data to identify a novel target, SV2A, involved in synaptic resilience.
Experimental Protocol:
- Data Curation: A knowledge graph was constructed with nodes representing proteins, genes, diseases, and drugs. Edges represented relationships (e.g., protein-protein interactions, genetic associations). Primary data sources included:
- ROSMAP cohort brain proteomics (8,000 proteins from dorsolateral prefrontal cortex).
- AD GWAS summary statistics (IGAP consortium).
- Public PPI databases (STRING, BioGRID).
- Model Training: A GraphSAGE model was trained to learn node embeddings. The objective was to predict "causal AD genes" from a curated gold-standard list, using network proximity as the supervisory signal.
- Prioritization & Validation: The model ranked proteins by predicted causal probability. Top candidate SV2A was validated in vitro.
- Validation Experiment:
- Cell Line: Human iPSC-derived neurons.
- Intervention: siRNA knockdown of SV2A vs. non-targeting control.
- Assays: (1) Synaptic density measured by Synaptophysin (SYP) and PSD95 immunofluorescence at 14 days. (2) Neuronal activity via multi-electrode array (MEA) at 21 days. (3) Aβ{42}-induced toxicity assay: cell viability after 72h exposure to 10 µM Aβ{42} peptide.
Quantitative Results:
Table 2: In Vitro Phenotypic Effects of SV2A Knockdown in iPSC-Derived Neurons
| Assay | siRNA Control (Mean ± SEM) | siRNA SV2A (Mean ± SEM) | % Change | p-value |
|---|---|---|---|---|
| Synaptic Puncta Density (SYP/PSD95) | 15.2 ± 0.8 / µm² | 9.1 ± 0.6 / µm² | -40.1% | <0.001 |
| MEA Mean Firing Rate (Hz) | 12.5 ± 1.2 | 6.8 ± 0.9 | -45.6% | <0.005 |
| Viability Post-Aβ_{42} (%) | 68.4 ± 3.1% | 42.7 ± 2.8% | -37.6% | <0.001 |
Visualization: AI-GNN Target Discovery & Validation Pathway
Rare Diseases: Generative AI for Drug Repurposing in Amyotrophic Lateral Sclerosis (ALS)
Background: ALS has a high unmet need and heterogeneous genetics. Generative AI models can rapidly screen existing drug libraries for potential repurposing candidates.
Case Study: Deep Generative Model for ALS Drug Screening A 2024 platform used a variational autoencoder (VAE) trained on molecular structures and gene expression perturbation profiles to identify cladribine as a modulator of TDP-43 pathology.
Experimental Protocol:
- Model Training: A VAE was trained on 1.2 million small molecule structures (from ZINC15) paired with simulated transcriptomic profiles from the LINCS L1000 database.
- Latent Space Interpolation: The model's latent space was navigated to generate "virtual molecules" with predicted gene expression signatures that reversed a core ALS signature (TDP-43 aggregation, oxidative stress).
- In Silico Screening: The generated ideal profile was used to query a database of approved drug structures via latent space similarity search.
- Validation Experiment:
- Model: NSC-34 motor neuron cell line with doxycycline-induced TDP-43 mislocalization.
- Compound: Cladribine (10 nM, 100 nM).
- Key Assays:
- TDP-43 Localization: Immunocytochemistry for TDP-43, quantifying cytoplasmic vs. nuclear fluorescence intensity ratio at 48h.
- Cell Viability: MTT assay at 72h.
- Biomarker: ELISA for phosphorylated neurofilament heavy chain (pNF-H) in supernatant at 48h.
Quantitative Results:
Table 3: Efficacy of AI-Predicted Drug Cladribine in TDP-43 Model
| Assay | Vehicle Control | Cladribine (100 nM) | p-value vs. Control |
|---|---|---|---|
| Cytoplasmic/Nuclear TDP-43 Ratio | 2.5 ± 0.3 | 1.4 ± 0.2 | <0.001 |
| Cell Viability (% of Untreated) | 100 ± 5% | 92 ± 4% | 0.12 (NS) |
| Secreted pNF-H (pg/mL) | 450 ± 35 | 280 ± 28 | <0.005 |
Visualization: Generative AI Drug Repurposing Pipeline
The Scientist's Toolkit: Key Reagents for ALS In Vitro Validation
| Reagent / Solution | Function in Protocol |
|---|---|
| NSC-34 Cell Line (TDP-43 Inducible) | In vitro model of motor neuron TDP-43 proteinopathy. |
| Anti-TDP-43 Antibody (C-terminal) | Immunostaining to quantify mislocalization (cytoplasmic vs. nuclear). |
| pNF-H ELISA Kit | Quantifies a pharmacodynamic biomarker of axonal injury. |
| Cladribine (2-CdA) | AI-predicted repurposing candidate; nucleoside analog. |
| Doxycycline Hyclate | Induces expression of mutant TDP-43 in the stable cell line. |
These case studies demonstrate that AI is no longer merely an auxiliary tool but is now integral to the core of biopharmaceutical R&D. In oncology, multi-modal AI creates superior predictive biomarkers. In neurology, network-based AI uncovers novel biological targets within complex pathophysiology. For rare diseases, generative AI accelerates the identification of viable therapeutic candidates from existing assets. The consistent theme is the use of AI to integrate and interpret high-dimensional, heterogeneous biological data, thereby generating testable hypotheses with increasing speed and mechanistic relevance. This convergence is defining a new standard for precision medicine across diverse therapeutic areas.
Navigating the Challenges: Overcoming Data, Model, and Translational Hurdles in AI-Biotech
The convergence of artificial intelligence (AI) and biotechnology represents a transformative frontier in biomedicine, promising accelerated drug discovery and personalized therapeutic strategies. However, the efficacy of AI models is fundamentally constrained by the quality, quantity, and diversity of their training data. This whitepaper examines the core challenges of data scarcity, inherent bias, and multi-modal integration within this convergent field, providing technical guidance for researchers and drug development professionals.
The Triad of Core Challenges
Data Scarcity in High-Quality Biomedical Data
The generation of validated, clinically annotated biological data remains expensive and time-consuming. This is especially acute for rare diseases and longitudinal multi-omics studies.
Table 1: Quantifying Data Scarcity in Key Biomedical Domains
| Data Domain | Estimated Publicly Available Datasets (2024) | Major Access Barriers | Typical Sample Size Per Study |
|---|---|---|---|
| Whole Genome Sequencing (Patient) | ~2.5 Million (Global Initiatives) | Patient Privacy, Storage Costs | 1,000 - 100,000 |
| Single-Cell RNA Sequencing | ~10,000 Studies (Public Repositories) | Technical Noise, Annotation Depth | 10,000 - 1M Cells |
| Cryo-EM Protein Structures | ~20,000 Entries (PDB) | Instrument Cost, Expertise | 1-10 Structures/Study |
| Clinical Trial -Omics Integration | < 5% of Trials | Proprietary Data, Lack of Standardization | 50 - 500 Patients |
Systemic Biases in Training Data
Biases propagate from source populations, experimental protocols, and data processing pipelines, leading to models with reduced generalizability and equity concerns.
Table 2: Common Sources and Impacts of Bias in Biomedical Datasets
| Bias Source | Example in Biotech AI | Potential Impact on Model Performance |
|---|---|---|
| Population Stratification | Overrepresentation of European Ancestry in Genomic Databases | Reduced diagnostic accuracy in underrepresented populations. |
| Experimental Batch Effects | scRNA-seq data from different labs/protocols | Batch effects dominate biological signal, obscuring true variation. |
| Annotation Subjectivity | Pathologist variance in histopathology labels | Models learn annotator-specific patterns, not generalizable features. |
| Digital Phenotyping Bias | Data from specific wearable device brands | Models become device-specific, not reflective of broader physiology. |
The Multi-Modal Integration Imperative
True biological insight requires synthesizing data from disparate modalities (e.g., genomics, imaging, proteomics, clinical records), each with different scales, distributions, and missingness patterns.
Experimental Protocols for Addressing Data Challenges
Protocol for Generating Synthetic Data via Diffusion Models
Aim: To augment scarce biomedical imaging data (e.g., histopathology, medical scans) while preserving class-specific biological features.
Materials:
- Source dataset: A curated set of annotated biomedical images.
- Hardware: GPU cluster with ≥ 16GB VRAM per node.
- Software: PyTorch, MONAI, custom diffusion model scripts.
Methodology:
- Preprocessing: Normalize pixel intensities per image channel. Apply weak augmentation (rotation, flip) to original dataset.
- Forward Diffusion Process: For each training image, progressively add Gaussian noise over T timesteps (e.g., T=1000) to create a Markov chain of increasingly noisy images.
- Model Training: Train a U-Net-based neural network to predict the noise component at a given timestep
t. The loss function is mean squared error between predicted and true noise:L = E[|| ε - ε_θ(x_t, t, c) ||^2], wherecis a conditioning vector (e.g., disease class). - Reverse Sampling (Generation): Start from pure noise
x_T. For t = T to 1, use the trained modelε_θto predict and subtract noise, gradually denoising to generate a new imagex_0conditioned on a desired class label. - Validation: Use a pre-trained, held-out classifier to assess the fidelity and diversity of generated images (Frechet Inception Distance adapted for medical images).
Protocol for De-biasing a Genomic Association Study
Aim: To correct for population stratification bias in a genome-wide association study (GWAS) dataset.
Materials:
- Genotype data (SNP arrays or WGS) with phenotypic labels.
- Principal Component Analysis (PCA) software (PLINK, Hail).
- Linear mixed model software (REGENIE, SAIGE).
Methodology:
- Quality Control: Filter SNPs for call rate > 98%, minor allele frequency > 1%, and Hardy-Weinberg equilibrium p > 1x10^-6. Filter samples for genotype call rate > 95%.
- Population Structure Inference: Perform PCA on a linkage-disequilibrium-pruned set of autosomal SNPs. Visually inspect PC plots to identify genetic outliers and major ancestry groups.
- Covariate Inclusion: Include the top
kprincipal components (typically k=5-10) as covariates in the association model to adjust for broad-scale population stratification. - Model Fitting: Use a linear mixed model (LMM) that incorporates a genetic relationship matrix (GRM) as a random effect to account for finer-scale relatedness and residual population structure:
y = Xβ + Zu + ε, whereu ~ N(0, σ_g^2 GRM). - Validation: Quantile-Quantile (Q-Q) plot of association p-values to check for residual inflation of test statistics (λGC ≈ 1.0).
Protocol for Multi-Modal Integration with Late Fusion
Aim: To integrate gene expression, histology image patches, and clinical variables for patient outcome prediction.
Materials:
- Paired datasets: RNA-seq data, whole-slide images (WSI), and clinical tabular data for the same patient cohort.
- Deep learning framework (TensorFlow/PyTorch) with specialized libraries (OpenSlide, CUDA).
Methodology:
- Unimodal Encoding:
- Genomics: Process RNA-seq counts via a transformer or fully connected network to generate an embedding vector
g. - Imaging: Extract tissue patches from WSIs. Encode each patch via a pre-trained ResNet. Apply multiple-instance learning (MIL) attention pooling to produce a slide-level embedding vector
i. - Clinical: Normalize continuous variables and one-hot encode categorical variables. Process through a feed-forward network to generate embedding
c.
- Genomics: Process RNA-seq counts via a transformer or fully connected network to generate an embedding vector
- Fusion & Joint Modeling: Concatenate the unimodal embeddings:
f = [g; i; c]. Pass the fused vectorfthrough a final multilayer perceptron (MLP) classifier for prediction (e.g., survival risk). - Training: Use a weighted sum of unimodal and fused losses during training to encourage robust unimodal representations before fusion:
L_total = L_g + L_i + L_c + α * L_fused. - Interpretation: Use gradient-based attribution methods (e.g., Saliency Maps, SHAP) on the fused model to identify contributing features from each modality.
Visualizing Workflows and Pathways
Diagram 1: Multi-modal AI integration workflow for drug discovery.
Diagram 2: Core data challenges and their technical solutions.
The Scientist's Toolkit: Research Reagent Solutions
Table 3: Essential Tools for Multi-Modal Data Generation and Integration
| Reagent/Tool Category | Specific Example | Function in Experimental Pipeline |
|---|---|---|
| Single-Cell Multi-Omics Kits | 10x Genomics Chromium Single Cell Multiome ATAC + Gene Expression | Enables simultaneous profiling of gene expression and chromatin accessibility from the same single cell, generating inherently linked multi-modal data. |
| Spatial Transcriptomics Platforms | Visium CytAssist (10x Genomics) or GeoMx DSP (Nanostring) | Captures gene expression data with direct spatial context from tissue sections, bridging histology and genomics. |
| Multiplexed Immunofluorescence | Akoya Biosciences CODEX/Phenocycler or mIHC panels | Allows simultaneous imaging of 40+ protein markers on a single tissue section, generating high-dimensional imaging data. |
| Data Integration Software Suites | NVIDIA CLARA or Harmony (Integrative Analysis) | Provides optimized pipelines and algorithms for fusing and analyzing diverse data types (e.g., imaging, -omics) at scale. |
| Synthetic Data Generation Platforms | Syntegra AI Engine or MDaaS (Medical Data as a Service) platforms | Generates privacy-preserving, synthetic patient data that mirrors statistical properties of real-world datasets for augmentation. |
The convergence of artificial intelligence (AI) and biotechnology represents a paradigm shift in biological discovery and therapeutic development. Within this convergence, a critical barrier to adoption and trust is the "black box" nature of advanced machine learning models, particularly deep neural networks. This whitepaper provides an in-depth technical guide to strategies for interpreting and explaining AI models in biological contexts, ensuring that predictions are actionable, verifiable, and compliant with regulatory standards.
Core XAI Methodologies: A Technical Taxonomy
Model-Specific vs. Model-Agnostic Approaches
- Model-Specific: Techniques intrinsic to a model's architecture (e.g., attention mechanisms in transformers, feature importance in tree-based models).
- Model-Agnostic: Post-hoc techniques applied after model training (e.g., SHAP, LIME, partial dependence plots).
Local vs. Global Explanations
- Local: Explain an individual prediction (e.g., why a specific genomic variant was classified as pathogenic).
- Global: Explain the model's overall behavior and learned relationships across the dataset.
Quantitative Comparison of Leading XAI Techniques
Table 1: Performance and Applicability of Core XAI Methods in Biological Contexts
| Method | Category | Computational Cost | Biological Interpretability | Best For | Key Limitation |
|---|---|---|---|---|---|
| SHAP (SHapley Additive exPlanations) | Model-Agnostic | High | High | Genomics, Proteomics, Drug Response | Exponential computation time for exact values; approximations needed. |
| Integrated Gradients | Model-Specific (DNNs) | Medium | Medium | Image Analysis (Microscopy), Sequence Models | Requires a baseline input; sensitivity to path choice. |
| Attention Weights | Model-Specific (Transformers) | Low | Medium-High | Protein Language Models, Sequence-to-Function | Weights indicate importance, not necessarily causality. |
| LIME (Local Interpretable Model-agnostic Explanations) | Model-Agnostic | Medium | Medium | Any black-box model on tabular data | Instability; explanations can vary for similar inputs. |
| Partial Dependence Plots (PDP) | Model-Agnostic | Medium-High | High | Understanding feature interactions (e.g., gene-gene) | Assumes feature independence; can be misleading with correlated features. |
| Counterfactual Explanations | Model-Agnostic | Varies | Very High | Clinical Diagnostics, Lead Optimization | Requires defining plausible alternative inputs. |
Experimental Protocols for Validating XAI in Biology
Protocol: In Silico Saturation Mutagenesis with SHAP
Aim: To interpret a deep learning model predicting transcription factor binding sites.
- Model: Train a convolutional neural network (CNN) on DNA sequence windows labeled as bound/unbound via ChIP-seq data.
- Perturbation: For a given predictive sequence, generate all possible single-nucleotide mutants.
- Prediction & Calculation: Pass all mutants through the trained CNN. Calculate SHAP values for each nucleotide position by comparing predictions of mutants to the wild-type sequence.
- Validation: Compare high-magnitude SHAP value positions to known motif positions from databases like JASPAR. Perform in vitro gel shift assays (EMSA) on top-scoring wild-type and mutant sequences for biochemical validation.
Protocol: Attention-Based Analysis of Protein Language Models
Aim: To identify functionally critical residues in a protein of unknown function.
- Model: Utilize a pre-trained transformer model (e.g., ESM-2, ProtT5).
- Input & Inference: Input the amino acid sequence of the target protein. Extract attention matrices from specified layers (often final layers focus on global structure).
- Aggregation: Compute attention flow or mean attention received by each residue across all attention heads in the selected layer.
- Analysis & Mapping: Rank residues by aggregated attention score. Map high-attention residues onto a predicted or experimental 3D structure (e.g., from AlphaFold2) to identify potential active sites or protein-protein interaction interfaces.
- Experimental Follow-up: Design site-directed mutagenesis experiments on top-ranked residues and assay for functional loss.
Visualization of Core XAI Concepts and Workflows
XAI Method Taxonomy for Biology
SHAP Analysis for Variant Effect Prediction
From Attention Maps to Functional Sites
The Scientist's Toolkit: Research Reagent Solutions for XAI Validation
Table 2: Essential Materials for Experimental Validation of XAI Predictions
| Item | Function in XAI Validation | Example/Supplier |
|---|---|---|
| Site-Directed Mutagenesis Kit | To experimentally test the functional importance of specific residues/nucleotides identified by XAI methods. | Q5 Site-Directed Mutagenesis Kit (NEB), QuickChange (Agilent). |
| Electrophoretic Mobility Shift Assay (EMSA) Kit | To validate predicted protein-DNA/RNA interactions from sequence models. | LightShift Chemiluminescent EMSA Kit (Thermo Fisher). |
| Reporter Gene Assay System | To test the functional impact of regulatory sequences or variants (e.g., luciferase, GFP). | Dual-Luciferase Reporter Assay System (Promega). |
| CRISPR-Cas9 Editing Tools | For knock-in/knock-out of variants or elements in cellular models to assess phenotype. | Synthetic sgRNAs, Cas9 enzyme (Integrated DNA Technologies, Synthego). |
| High-Content Imaging System | To quantify complex phenotypic outcomes from perturbations guided by XAI (e.g., organoid morphology). | Instruments from PerkinElmer, Molecular Devices. |
| Surface Plasmon Resonance (SPR) Chip | To biophysically validate predicted protein-protein or protein-small molecule interactions with kinetic data. | Biacore Series S Sensor Chips (Cytiva). |
| Saturation Mutagenesis Library | For empirical benchmarking of in-silico saturation mutagenesis predictions. | Custom oligo pools (Twist Bioscience). |
The integration of Artificial Intelligence (AI) and systems biology represents a paradigm shift in biomedical research, offering unprecedented capabilities to model complex biological systems in silico. However, a persistent and costly gap remains between computational predictions and successful in vivo outcomes, leading to high rates of translational failure in drug development. This whitepaper, situated within a broader thesis on AI-biotechnology convergence, outlines a rigorous, multi-modal validation framework designed to systematically de-risk the translational pipeline. We present current data, detailed experimental protocols, and essential toolkits to empower researchers in building more predictive and reliable bridges from computation to clinic.
The Translational Failure Landscape: Quantitative Analysis
Recent analyses continue to highlight the attrition rates in drug development, particularly between preclinical phases and clinical success. The following table summarizes key quantitative data on translational success rates and associated costs.
Table 1: Analysis of Translational Attrition and Associated Costs (2022-2024 Data)
| Development Phase | Overall Likelihood of Approval | Primary Causes of Attrition | Average Cost per Program (USD Millions) | Impact of Improved Preclinical Prediction |
|---|---|---|---|---|
| Preclinical to Phase I | ~52% | Lack of efficacy in relevant models, undisclosed toxicity, poor PK/PD | 10 - 15 | Highest potential for cost avoidance |
| Phase I to Phase II | ~43% | Safety, pharmacokinetics, pharmacodynamics | 20 - 40 | Critical for mechanism validation |
| Phase II to Phase III | ~27% | Efficacy in target population, safety in broader cohort | 50 - 100 | Focus on patient stratification biomarkers |
| Phase III to Submission | ~57% | Statistical significance, safety in large population, regulatory | 100 - 300 | Late-stage failures are most costly |
| Cumulative (Preclinical to Approval) | ~7-10% | Collective integration of above factors | ~1,300 - 2,800+ | A 10% improvement in preclinical prediction could save ~$100M per drug |
Data synthesized from recent reviews by BIO, DiMasi et al., 2023, and Nature Reviews Drug Discovery analysis (2024).
Core Validation Pipeline: A Hierarchical Framework
A robust validation pipeline must interrogate a hypothesis across increasing biological complexity and physiological relevance. The following workflow diagram outlines this hierarchical approach.
Diagram 1: Hierarchical Multi-Scale Validation Pipeline (94 chars)
Detailed Experimental Protocols for Key Validation Tiers
Protocol: Functional Interrogation in a 3D Human IPSC-Derived Organoid Model
Purpose: To validate AI-predicted target engagement and phenotypic response in a physiologically relevant human cellular system.
Materials: See "Scientist's Toolkit" in Section 6.
Methodology:
- Organoid Generation: Differentiate human induced pluripotent stem cells (iPSCs) into target tissue-specific organoids using established, serum-free differentiation protocols (e.g., intestinal, hepatic, cerebral). Culture in Matrigel domes with appropriate growth factor cocktails for 20-40 days, with medium changes every 2-3 days.
- Characterization: At maturity, validate organoid composition via:
- Immunofluorescence (IF): Fix a subset, section, and stain for 3+ cell-type-specific markers (e.g., EpCAM, Villin for enterocytes; Lysozyme for Paneth cells in gut).
- qPCR: Isolve RNA and assess expression of key lineage genes relative to parental iPSCs.
- Compound Treatment: Dissociate organoids into single cells or small clusters and re-embed in Matrigel. After 5 days of recovery, treat with the AI-predicted compound (or vehicle/DMSO control) across a 6-point dose-response range (e.g., 1nM - 100µM) for 72 hours. Include a reference standard compound if available.
- High-Content Phenotypic Screening: Fix and stain organoids for:
- Viability: Hoechst 33342 (nuclei) and Propidium Iodide (dead cells) or Caspase-3/7 activation.
- Proliferation: EdU incorporation assay.
- Target Engagement: IF for direct target (e.g., phosphorylated protein) or downstream effector (e.g., pS6 for mTOR pathway).
- Image Acquisition & Analysis: Acquire z-stack images on a confocal high-content imager. Use 3D image analysis software (e.g., Imaris, Arivis) to quantify organoid size, number, viability ratio, and mean fluorescence intensity for target markers per organoid.
- Data Analysis: Fit dose-response curves (4-parameter logistic) to determine IC50/EC50 values. Compare AI-predicted efficacy/potency to observed values. Statistical significance assessed via one-way ANOVA with post-hoc test.
Protocol: Multi-Omic Validation in a Patient-Derived Xenograft (PDX) Model
Purpose: To confirm mechanism of action (MoA) and efficacy predicted in silico in an in vivo context capturing human tumor heterogeneity.
Methodology:
- Model Establishment: Implant fragments of human patient tumor tissue (passage 3-5) subcutaneously into immunodeficient NSG mice. Monitor until tumors reach ~150-200 mm³.
- Study Design: Randomize mice (n=8-10 per group) into: Vehicle control, AI-predicted compound (at two dose levels), and standard-of-care control arm.
- Dosing & Monitoring: Administer compounds via predetermined route (oral/IP/IV) per schedule. Measure tumor volume (calipers) and body weight bi-weekly for 28 days.
- Endpoint Analysis:
- Harvest: At study end, excise tumors. Divide each: one part snap-frozen in liquid N2 for omics, one part in formalin for IHC, one part fresh for flow cytometry.
- Pharmacodynamic (PD) Assessment:
- Western Blot/IHC: Analyze target pathway modulation (e.g., phospho-ERK/total ERK).
- RNA-Seq: Extract total RNA from frozen tissue. Perform sequencing (30M reads, paired-end). Conduct differential expression analysis (DESeq2) and Gene Set Enrichment Analysis (GSEA) to verify predicted pathway regulation.
- LC-MS Metabolomics: Perform untargeted metabolomics on tumor extracts to identify metabolic shifts consistent with predicted MoA.
- Correlative Analysis: Integrate in vivo tumor growth inhibition (TGI%) with omics-derived PD biomarkers. Use linear mixed-effects models to correlate early PD changes with final TGI.
Critical Pathway for Translational Failure Mitigation
A primary source of failure is unpredicted toxicity due to pathway crosstalk or off-target effects. The following diagram maps a key signaling network often involved in oncology targets and its connection to critical toxicity pathways, highlighting nodes for validation.
Diagram 2: mTOR Pathway Crosstalk & Toxicity Nodes (85 chars)
The Scientist's Toolkit: Essential Research Reagent Solutions
Table 2: Key Reagents and Platforms for Translational Validation
| Item / Solution | Function in Validation Pipeline | Example Vendors/Platforms |
|---|---|---|
| Human iPSCs & Differentiation Kits | Provides genetically defined, human-derived source material for organoid generation. | Cellular Dynamics International (Fujifilm), Thermo Fisher, Stemcell Technologies |
| Extracellular Matrix (ECM) Hydrogels | Provides 3D physiological scaffolding for organoid and spheroid culture. | Corning Matrigel, Cultrex BME, synthetic PEG-based hydrogels (Cellendes) |
| High-Content Imaging Systems | Automated, quantitative 3D imaging of complex cellular models for phenotypic analysis. | PerkinElmer Operetta/Opera, Molecular Devices ImageXpress, Yokogawa CV8000 |
| PDX Repository Access | Provides clinically relevant, heterogeneous tumor models for in vivo efficacy testing. | Jackson Laboratory PDX, Champions Oncology, Charles River Laboratories |
| Spatial Transcriptomics Platform | Maps gene expression within tissue architecture, linking MoA to histopathology. | 10x Genomics Visium, Nanostring GeoMx DSP, Akoya CODEX |
| LC-MS/MS for Proteomics/Metabolomics | Enables unbiased quantification of protein and metabolite changes for MoA/toxicity studies. | Agilent, Thermo Fisher (Orbitrap), Sciex (TripleTOF) platforms |
| AI-Ready Data Analysis Suites | Integrates multi-omic and phenotypic data for model refinement and biomarker discovery. | Dotmatics, Genedata, Partek Flow, DNAnexus |
The convergence of artificial intelligence (AI) and biotechnology represents a paradigm shift in life sciences research and drug development. This synergy, however, generates unprecedented computational demands. High-throughput sequencing, cryo-electron microscopy, and automated phenotypic screening produce petabytes of multimodal data. Analyzing this data to uncover biological signaling pathways or predict protein-ligand interactions requires immense computational power and sophisticated, reproducible machine learning (ML) pipelines. Traditional on-premises High-Performance Computing (HPC) clusters often struggle with the elastic, heterogeneous, and collaborative needs of modern computational biology. This guide details how integrating Cloud HPC resources with robust Machine Learning Operations (MLOps) practices creates a scalable, efficient, and collaborative foundation for research at the AI-biotech frontier.
Architectural Blueprint: Integrating Cloud HPC with MLOps
A scalable research workflow seamlessly blends batch HPC jobs for simulation and genomics with interactive ML development and automated deployment.
Diagram Title: Cloud HPC-MLOps Architecture for AI-Biotech Research
Core Quantitative Comparisons: Cloud HPC & MLOps Platforms
Selecting the right cloud services is critical. The table below compares core capabilities relevant to computational biology as of early 2024.
Table 1: Comparison of Major Cloud HPC & AI/ML Service Offerings
| Provider & Service | HPC Orchestration | Specialized AI/ML Hardware | Managed MLOps Tools | Biotech-Optimized Services | Approx. Cost for a 100k-core Genome Assembly |
|---|---|---|---|---|---|
| AWS (ParallelCluster, Batch) | Elastic, Slurm/PBS/Batch | Trainium, Inferentia, NVIDIA | SageMaker (Pipelines, Experiments) | HealthOmics, BioIT on AWS | ~$3,200 - $4,500 |
| Google Cloud (Batch, Cloud HPC) | Slurm/GROMACS via K8s | Cloud TPU v5e, NVIDIA A100/H100 | Vertex AI (Pipelines, MLMD) | Life Sciences API, AlphaFold DB Integration | ~$2,800 - $3,800 |
| Azure (CycleCloud, Batch) | Slurm/PBS/HTCondutor | NVIDIA ND A100 v4 Series, AMD MI300X | Azure Machine Learning | Azure Genomics, Open Science Initiatives | ~$3,500 - $4,200 |
| Oracle Cloud (HPC, OCI) | Slurm, OpenFOAM clusters | NVIDIA A100 (bare metal) | Data Science (with MLflow) | OCI for Healthcare & Life Sciences | ~$3,000 - $4,000 |
Note: Costs are estimates for a 2-hour, 100,000 vCPU-core job using general-purpose instances and can vary significantly based on region, discounts, and specific instance type selection. Spot/preemptible instances can reduce costs by 60-80%.
Table 2: Popular MLOps Tools for Research Reproducibility
| Tool Category | Open Source Examples | Managed Cloud Services | Key Function in Biotech Workflow |
|---|---|---|---|
| Experiment Tracking | MLflow, Weights & Biases, DVC | SageMaker Experiments, Vertex AI Experiments | Log hyperparameters, metrics, and model weights for drug target prediction models. |
| Workflow Orchestration | Nextflow, Snakemake, Apache Airflow | AWS Step Functions, Cloud Composer | Orchestrate multi-step pipelines (e.g., QC -> Alignment -> Variant Calling). |
| Model Registry | MLflow Model Registry | SageMaker Model Registry, Vertex AI Model Registry | Version control and stage trained protein folding models for validation. |
| Feature Store | Feast, Hopsworks | SageMaker Feature Store, Vertex AI Feature Store | Serve consistent molecular descriptors for training and inference. |
Detailed Experimental Protocols
Protocol 4.1: Scalable Virtual Screening on Cloud HPC
This protocol outlines a structure-based virtual screening workflow leveraging cloud HPC for parallelized molecular docking.
Objective: To identify potential small-molecule inhibitors for a target protein from a library of 10+ million compounds.
Materials:
- Target: Prepared protein structure (PDB format).
- Ligand Library: Pre-processed compound library (e.g., ZINC20, Enamine REAL) in SDF or SMILES format.
- Software: Docking software (e.g., AutoDock Vina, UCSF DOCK6), containerized.
- Compute: Cloud HPC pool with 1000+ CPU cores.
Methodology:
- Environment Setup:
- Containerize the docking software and all dependencies using Docker/Singularity.
- Push the container to a cloud container registry (e.g., Amazon ECR, Google Container Registry).
- Data Preparation:
- Upload the target protein and partitioned ligand library chunks to high-throughput cloud object storage (e.g., Amazon S3, Google Cloud Storage).
- Define the docking grid box coordinates computationally or based on known binding sites.
- Job Orchestration:
- Write a Nextflow/Snakemake script defining the pipeline:
prepare_input -> parallel_docking -> aggregate_results. - The
parallel_dockingprocess is mapped over each ligand library chunk.
- Write a Nextflow/Snakemake script defining the pipeline:
- Execution on Cloud HPC:
- Launch a managed HPC cluster (e.g., using AWS ParallelCluster) or a Kubernetes cluster with a batch scheduler.
- Submit the pipeline job. The orchestrator dynamically provisions the required compute nodes (e.g., 1000 cores), pulls the container, and processes each ligand chunk in parallel.
- Results Aggregation & Analysis:
- The pipeline automatically aggregates all docking scores and poses into a single ranked list.
- Output results (top hits, poses) are written back to object storage.
- Top candidates are registered as a dataset in the MLOps platform for downstream analysis or model training.
Protocol 4.2: Training a Predictive ADMET Model with MLOps
This protocol details an MLOps-driven experiment to train and log a model predicting Absorption, Distribution, Metabolism, Excretion, and Toxicity (ADMET) properties.
Objective: To develop a reproducible ML model that predicts human liver microsomal stability (HLM) from molecular structure.
Materials:
- Dataset: Curated public HLM dataset (e.g., from ChEMBL) with SMILES strings and measured half-life (% remaining).
- Features: RDKit or Mordred descriptors, or pre-trained molecular graph embeddings.
- Software: Python (scikit-learn, PyTorch, DeepChem), MLflow for tracking.
Methodology:
- Experiment Initialization:
- Start an MLflow run within the project code, tagging it with the researcher's name and project ID.
- Data Versioning & Splitting:
- Log the raw dataset hash or version using DVC or MLflow artifacts.
- Perform a stratified split (80/10/10 train/validation/test) and log the split indices.
- Hyperparameter Training Loop:
- Define a hyperparameter search space (e.g., learning rate, network architecture, dropout).
- For each hyperparameter set:
- Log all parameters using
mlflow.log_params(). - Train the model (e.g., Graph Neural Network) on the training set.
- Evaluate on the validation set; log metrics (RMSE, R²) using
mlflow.log_metrics(). - Log the trained model artifact and key visualizations (e.g., parity plots).
- Log all parameters using
- Model Promotion:
- Select the best-performing model based on validation metrics.
- Evaluate the final model on the held-out test set and log the final metrics.
- Register the model to the MLflow Model Registry, transitioning it to the "Staging" phase for peer validation.
- Deployment for Inference:
- Package the staged model into a REST API endpoint or batch inference container using MLflow's built-in tools.
- Deploy the container to a managed cloud service (e.g., AWS SageMaker Endpoints, Google Cloud Run) for team-wide use in compound prioritization.
The Scientist's Toolkit: Essential Research Reagent Solutions
Table 3: Key Computational "Reagents" for AI-Driven Biotech Research
| Item / Solution | Function in Workflow | Example Specific Tools / Services |
|---|---|---|
| Workflow Orchestrator | Defines, executes, and manages complex, multi-step computational pipelines, ensuring portability and reproducibility. | Nextflow, Snakemake, Cromwell (WDL). |
| Containerization Platform | Packages software, libraries, and environment into a single, portable unit that runs consistently on any cloud or HPC system. | Docker, Singularity/Apptainer, Podman. |
| Experiment Tracker | Acts as a "digital lab notebook" for ML, meticulously logging parameters, code versions, metrics, and outputs for every model training run. | MLflow, Weights & Biases, TensorBoard. |
| Molecular Docking Engine | Computationally predicts how a small molecule (ligand) binds to a target protein, enabling virtual screening. | AutoDock Vina, UCSF DOCK, Glide (Schrödinger). |
| Molecular Dynamics (MD) Suite | Simulates the physical movements of atoms and molecules over time, providing insights into protein flexibility and binding kinetics. | GROMACS, AMBER, NAMD, OpenMM. |
| AlphaFold Protein Structure DB | Provides instant, accurate protein structure predictions for nearly all catalogued proteins, revolutionizing target identification. | AlphaFold Database via Google Cloud Public Datasets. |
| Managed JupyterHub Service | Offers secure, scalable, and collaborative interactive compute environments for exploratory data analysis and prototyping. | Amazon SageMaker Studio, Google Vertex AI Workbench, Azure ML Notebooks. |
| FAIR Data Repository | Stores research data in a Findable, Accessible, Interoperable, and Reusable manner, often integrated with cloud analysis tools. | Terra.bio, DNAnexus, Seven Bridges. |
Visualizing a Core Signaling Pathway in Cancer Research
Understanding complex biological networks is a key application of this computational power. Below is a simplified representation of the PI3K/AKT/mTOR pathway, a frequently dysregulated signaling cascade in cancer and a prime target for therapeutic intervention.
Diagram Title: PI3K/AKT/mTOR Pathway and Therapeutic Inhibition
The effective convergence of AI and biotechnology is intrinsically dependent on a modern computational substrate. By leveraging Cloud HPC for elastic, powerful compute and embedding MLOps principles for reproducibility and collaboration, research teams can scale their inquiries from targeted in silico experiments to genome-wide, multi-omic analyses. This integrated approach accelerates the iterative cycle of hypothesis, computation, and validation, ultimately driving faster translation of biological insight into therapeutic breakthroughs. The protocols, tools, and architectural patterns outlined here provide a concrete foundation for building such a scalable research enterprise.
The convergence of artificial intelligence (AI) and biotechnology represents a paradigm shift in medical product development. This whitepaper, framed within broader research on this convergence, examines the critical regulatory and ethical frameworks governing AI-based medical products. As AI algorithms—from diagnostic support software to AI-driven drug discovery platforms—become integral to healthcare, navigating the guidelines set by the U.S. Food and Drug Administration (FDA) and the European Medicines Agency (EMA) is paramount for researchers and developers. This guide provides a technical roadmap for compliance and ethical integrity.
Current Regulatory Landscapes: FDA & EMA
FDA's Evolving Framework
The FDA categorizes AI-based medical products primarily as Software as a Medical Device (SaMD) or as components within Drug Discovery/Development tools. The Center for Devices and Radiological Health (CDRH) leads oversight through a risk-based framework (Class I, II, III). The pivotal Artificial Intelligence/Machine Learning (AI/ML)-Based Software as a Medical Device (SaMD) Action Plan and the Digital Health Innovation Action Plan outline a premarket review process emphasizing "Good Machine Learning Practice (GMLP)." The proposed "Predetermined Change Control Plan" allows for iterative algorithm updates post-market authorization under a defined protocol.
EMA's Holistic Approach
The EMA integrates AI-based tools into existing medicinal product regulations. Guidance is disseminated through various channels: the Human Medicines Board, the Medical Device Coordination Group (MDCG) under the Medical Device Regulation (MDR), and key documents like the ICH Q9 (R1) guideline on quality risk management. The EMA emphasizes the "qualification of novel methodologies" for drug development, requiring extensive validation within the proposed context of use. Unlike the FDA's product-specific focus, the EMA's approach is often embedded within the evaluation of the overall benefit-risk of a therapy.
Quantitative Comparison of Regulatory Pathways
Table 1: Key Quantitative Metrics in FDA & EMA AI/Medical Product Review (2022-2024)
| Metric | FDA (CDRH) | EMA |
|---|---|---|
| AI/ML-Enabled SaMD Submissions (Approved/Cleared) | ~ 692 (2018-2023) | Not separately categorized; assessed under MDR/IVDR |
| Median Total Review Time (Premarket Approval PMA) | ~ 180 days (Expedited) | ~ 210 days (Centralized Procedure for Medicines) |
| Key Regulatory Document | AI/ML SaMD Action Plan (2021) | Data Quality Guidance for AI in Medicine Dev (2022023) |
| Mandatory Pre-Submission Meeting? | Strongly Recommended (Q-Submission) | Highly Recommended (Advice Procedure) |
| Change Management Pathway | Predetermined Change Control Plan | Significant vs. Non-Significant Change (MDR Article 120) |
Core Ethical Considerations and Validation Protocols
Ethical deployment requires addressing algorithmic bias, explainability (XAI), and robust performance across diverse populations.
Protocol for Mitigating Dataset Bias
Objective: To ensure training data is representative and model performance is equitable across subpopulations defined by race, ethnicity, age, sex, and geography. Methodology:
- Data Collection & Annotation: Use multi-center, international sourcing where applicable. Annotate data with relevant demographic and clinical metadata using controlled vocabularies (e.g., SNOMED CT).
- Bias Audit: Calculate prevalence disparities and perform fairness metrics analysis (e.g., equalized odds, demographic parity difference) across subgroups using the
AI Fairness 360toolkit. - Stratified Sampling & Augmentation: If disparities >10% are found, employ stratified sampling to rebalance training sets. Use validated synthetic data generation (e.g., via Generative Adversarial Networks - GANs) only for augmentation, not replacement.
- Performance Validation: Test the final model on a held-out, diverse external validation cohort. Performance metrics (AUC, sensitivity, specificity) must not show statistically significant degradation (p<0.05) in any predefined subgroup compared to the majority population.
Figure 1: Bias Mitigation & Validation Workflow
Protocol for Explainability (XAI) Assessment
Objective: To provide clinically interpretable explanations for the AI model's outputs, crucial for regulatory trust and clinical adoption. Methodology:
- Model Selection: Prefer inherently interpretable models (e.g., decision trees, linear models) where performance is sufficient. For complex "black-box" models (e.g., deep neural networks), implement post-hoc XAI techniques.
- Post-Hoc Explanation Generation: For imaging models, generate saliency maps (e.g., Grad-CAM, Layer-wise Relevance Propagation - LRP). For tabular data, use SHAP (Shapley Additive exPlanations) values to quantify feature contribution.
- Clinical Relevance Evaluation: Conduct a blinded review with 3+ domain experts (e.g., radiologists, oncologists). Present model output + explanation. Experts rate explanation plausibility and alignment with clinical reasoning on a 5-point Likert scale. Mean score ≥4.0 is target.
- Documentation: Document the XAI method, its limitations, and integration into the user interface for the regulatory submission.
Figure 2: Explainability Assessment Protocol
The Scientist's Toolkit: Essential Research Reagents & Solutions
Table 2: Key Reagent Solutions for AI-Based Medical Product Development & Validation
| Item / Solution | Function in AI Medical Product Pipeline | Example Vendor/Platform |
|---|---|---|
| Synthetic Data Generation Platforms | Augments limited or imbalanced real-world datasets for training while preserving privacy. Critical for bias mitigation. | Mostly.ai, Syntegra, NVIDIA CLARA |
| De-identification & Anonymization Engines | Removes Protected Health Information (PHI) from training data to comply with HIPAA/GDPR. | AWS Comprehend Medical, Google Cloud DICOM De-id |
| Benchmarking Datasets | Provides gold-standard, publicly available data for model validation and comparative performance analysis. | Imaging: The Cancer Imaging Archive (TCIA), Genomics: The Cancer Genome Atlas (TCGA) |
| XAI Software Toolkits | Generates post-hoc explanations for model predictions, fulfilling regulatory demands for interpretability. | Captum (PyTorch), SHAP library, LRP Toolbox |
| MLOps & Model Monitoring Suites | Tracks model performance drift, manages versioning, and orchestrates retraining pipelines in a GxP-compliant manner. | Weights & Biases (W&B), MLflow, Domino Data Lab |
| Electronic Data Capture (EDC) Systems | Collects structured, high-quality clinical trial data essential for training and validating predictive models. | Medidata Rave, Oracle Clinical, Veeva Vault CDMS |
Integrated Development & Submission Workflow
A successful regulatory strategy integrates ethical and technical considerations from inception.
Figure 3: AI Medical Product Dev & Submission Path
Navigating FDA and EMA guidelines for AI-based medical products requires a proactive, interdisciplinary strategy rooted in robust science and ethical rigor. By embedding regulatory requirements—from representative data collection and bias mitigation to explainability and lifecycle management—into the core development workflow, researchers can accelerate the translation of AI innovations into safe, effective, and trustworthy medical products, thereby advancing the frontier of AI-biotechnology convergence.
Measuring Impact: Validating Success and Comparing Leading AI Platforms in Biotech
Within the broader thesis on the convergence of AI and biotechnology, evaluating the performance of AI models in drug discovery is paramount. Moving beyond abstract algorithmic accuracy, success is measured by tangible improvements in the preclinical pipeline. This technical guide details the core metrics, experimental protocols, and practical toolkits essential for rigorous benchmarking.
Core Performance Metrics & Quantitative Data
The efficacy of AI in drug discovery is quantified through a hierarchy of metrics, from initial computational screening to late-stage preclinical validation.
Table 1: Key AI Model Performance Metrics in Early Discovery
| Metric | Formula/Description | Industry Benchmark (Current) | AI-Enhanced Target |
|---|---|---|---|
| Enrichment Factor (EF) | EF = (Hit Rate_AI / Hit Rate_Random) | 2-5 (HTS) | >10 |
| Hit Rate | (Confirmed Active Compounds / Total Tested) × 100 | 0.01% - 0.1% | 1% - 10% |
| Screening Cost Reduction | Cost (Traditional HTS) / Cost (AI-Prioritized) | Baseline (1x) | 10x - 100x |
| Cycle Time (Design->Test) | Time from compound design to assay result | 4-6 months | 1-2 months |
| Molecular Property Optimization | % of generated molecules passing ADMET filters | <20% (de novo) | >60% |
| Synthetic Accessibility Score (SA) | 1 (Easy) to 10 (Hard); AI target: ≤4 | 6-8 (generated) | 3-4 |
Table 2: Impact Metrics in Lead Optimization
| Metric | Stage Measured | Traditional Benchmark | AI-Targeted Improvement |
|---|---|---|---|
| Potency (IC50/pIC50) | Biochemical & Cellular Assays | nM-µM range | Improvement by 1-2 log units |
| Selectivity Index | IC50(Off-Target) / IC50(On-Target) | >100-fold | >1000-fold |
| In Vitro PK Parameter Prediction Error | Prediction vs. Experimental (e.g., Clint, Solubility) | MAE ~ 0.7 log units | MAE < 0.5 log units |
| Rate of Attrition Due to PK | Lead-to-Candidate Stage | ~40% | Target <20% |
| Reduction in In Vivo Study Iterations | Needed for PK/PD modeling | 3-4 cycles | 1-2 cycles |
Experimental Protocols for Benchmarking AI Models
Protocol 1: Validating Virtual Screening Performance
Objective: Quantify the Enrichment Factor (EF) and hit rate of an AI screening model versus random or traditional methods.
- Dataset Curation: Use a publicly benchmarked dataset (e.g., DUD-E, DEKOIS 2.0) containing known actives and decoys for a specific target.
- Model Deployment: Employ the AI model (e.g., graph neural network, 3D pharmacophore) to score and rank all compounds in the dataset.
- Sampling: Select the top-N ranked compounds (e.g., N=100) as the AI-prioritized set. Randomly select an equal number of compounds as a control.
- In Vitro Validation: Conduct a primary biochemical assay (e.g., fluorescence polarization, TR-FRET) for all selected compounds.
- Analysis: Calculate EF at 1% (EF₁) and 10% (EF₁₀) of the screened library. Compare hit rates between AI and control sets using statistical tests (e.g., Fisher's exact test).
Protocol 2: Measuring Cycle Time Reduction in Design-Make-Test-Analyze (DMTA)
Objective: Objectively measure the reduction in time from compound design to confirmed activity result.
- Baseline Establishment: Document the median time for one complete cycle of the traditional DMTA loop for a specific project (typically 16-24 weeks).
- AI-Augmented Workflow: Implement an AI-driven generative model (e.g., REINVENT, MolGPT) coupled with synthesis route prediction (e.g., ASKCOS, AiZynthFinder).
- Parallel Experiment: Initiate a new lead optimization campaign for the same target using the AI-augmented workflow. Track time for each phase:
- Design: Time to generate 100 novel, synthesizable structures meeting target property profiles.
- Make: Time from finalized structure to purified compound, leveraging AI-prioritized routes.
- Test: Time for standardized activity and selectivity profiling.
- Analyze: AI-assisted SAR analysis for next-cycle design.
- Calculation: Compute total cycle time and compare to baseline. Perform over multiple cycles to establish statistical significance.
Visualizing AI-Augmented Drug Discovery Workflows
AI-Driven DMTA Cycle Acceleration
The Scientist's Toolkit: Research Reagent Solutions
Table 3: Essential Reagents & Platforms for AI-Benchmarking Experiments
| Item | Function in AI Benchmarking | Example Vendor/Product |
|---|---|---|
| Kinase Assay Kits (e.g., ADP-Glo) | Provide standardized, high-throughput biochemical assays for validating AI-predicted actives against kinase targets. | Promega |
| Cell-Based Reporter Assay Kits (Luciferase/GFP) | Enable functional validation of compounds in a cellular context, testing AI predictions of efficacy and toxicity. | Thermo Fisher Scientific |
| Pan-Assay Interference Compounds (PAINS) Filters | Computational or chemical libraries used to eliminate promiscuous compounds that may create false-positive AI training data. | MilliporeSigma |
| Ready-to-Assay GPCR/Cell Line | Stable, consistent cell lines for testing compound activity against GPCRs, a major AI drug discovery target class. | Eurofins DiscoverX |
| Microsomes & Hepatocytes (Pooled) | Essential for experimental validation of AI-predicted ADMET properties, specifically metabolic stability (Clint). | BioIVT, Corning |
| Fragment Libraries for Screening | Curated, diverse chemical libraries used as inputs for AI-based de novo molecule generation and expansion. | Enamine, Charles River |
| Caco-2 Cell Permeability Assay Kit | Standardized in vitro assay to validate AI predictions of intestinal absorption/permeability. | ATCC |
| hERG Channel Inhibition Assay Kit | Critical for experimental testing of AI-predicted cardiac toxicity risk. | MilliporeSigma |
| Cloud Computing Platform (GPU-Accelerated) | Provides the computational infrastructure for training and running large-scale AI/ML models in drug discovery. | AWS, Google Cloud, Azure |
Effective benchmarking of AI in drug discovery requires a multi-faceted approach integrating rigorous computational metrics, standardized experimental validation protocols, and specialized research toolkits. Success is ultimately defined by measurable improvements in the key efficiency drivers of the pipeline—higher-quality leads, reduced costs, and significantly accelerated timelines—advancing the core thesis of the AI-biotechnology convergence.
This whitepaper provides an in-depth technical analysis of leading AI-driven drug discovery platforms, framed within the broader thesis of AI and biotechnology convergence. This convergence represents a paradigm shift from traditional, linear discovery processes to iterative, data-centric cycles of hypothesis generation, validation, and optimization.
Platform Architectures & Core Technologies
Insilico Medicine
Core Approach: Generative adversarial networks (GANs) and reinforcement learning for de novo molecular design. PandaOmics: For target identification using multi-omics data and text mining of scientific literature. Chemistry42: A generative chemistry suite that designs novel molecular structures with desired properties. It employs a hybrid AI model combining 42+ generative algorithms with physics-based simulations.
Recursion Pharmaceuticals
Core Approach: Phenotypic drug discovery powered by high-content cellular imaging and convolutional neural networks (CNNs). Recursion Operating System (OS): An integrated system that conducts massive-scale, automated cell biology experiments. It treats cellular disease models with chemical and genetic perturbations, images them, and extracts morphological "phenoprints" using deep learning. Similarities between phenoprints indicate potential mechanism of action or therapeutic efficacy.
Exscientia
Core Approach: Centaur-driven design, where AI (CentaurAI) proposes and prioritizes compounds for human expert evaluation. Platform Components:
- Active-Derived Design: Uses iterative AI models to learn from experimental data and guide the next cycle of synthesis.
- Precision Target & Drug Design: Integrates genomic and proteomic data to identify patient-specific targets and design selective compounds.
Other Notable Platforms
- BenevolentAI: Employs a knowledge graph that integrates vast biomedical data (literature, patents, omics, clinical trials) to infer novel disease-target and target-drug relationships.
- Relay Therapeutics: Specializes in "Dynamics-driven drug discovery," using computational methods and experimental structural biology to analyze protein motion (conformations) and design allosteric inhibitors.
Table 1: Comparative Overview of Platform Architectures
| Platform | Core AI Technology | Primary Discovery Phase | Key Data Input | Output |
|---|---|---|---|---|
| Insilico Medicine | GANs, RL, Transformers | Target ID, Molecule Design | Omics data, literature, known ligands | Novel molecular structures |
| Recursion | Convolutional Neural Networks (CNNs) | Phenotypic Screening | Cellular microscopy images | Phenotypic hit compounds, MoA hypotheses |
| Exscientia | Bayesian ML, Active Learning | Molecule Design & Optimization | Biochemical/ phenotypic assay data | Optimized lead compounds |
| BenevolentAI | Knowledge Graph, NLP | Target Identification | Structured/ unstructured biomedical data | Novel target-disease hypotheses |
| Relay Therapeutics | Molecular Dynamics Simulation | Lead Optimization | Protein structural data, biophysical data | Allosteric inhibitors for difficult targets |
Experimental Protocols & Methodologies
Protocol: Recursion's Phenotypic Screening Workflow
Aim: To identify compounds that reverse a disease-associated cellular phenotype.
- Cell Model Generation: Engineer disease-relevant cell lines (e.g., with a genetic mutation) and isogenic controls.
- Perturbation & Staining: Plate cells in 384-well plates. Treat with ~2,000+ compounds from the Recurrence Library or known bioactive libraries. Fix and stain for relevant cellular structures (nuclei, cytoskeleton, organelles).
- High-Content Imaging: Automatically image plates using confocal microscopy, capturing 1000+ features/well across multiple channels.
- Phenoprint Extraction: Process images with a CNN to generate a high-dimensional vector (phenoprint) representing the morphological state of each well.
- Similarity Analysis: Compute similarity (e.g., cosine similarity) between compound-treated disease model phenoprints and healthy control phenoprints. Hits are compounds that shift the disease phenoprint towards "health."
- MoA Inference: Cluster hit compounds based on phenoprint similarity; compounds clustering together are predicted to share a mechanism of action.
Protocol: Insilico's Generative Chemistry Cycle
Aim: To generate a novel, synthesizable compound with high predicted activity against a target.
- Input Specification: Define desired properties: target (e.g., kinase X), IC50 range, ligand efficiency, PAINS filters, synthetic accessibility (SA) score.
- Generator Phase: The generator network (G) proposes new molecular structures (SMILES strings) based on the input constraints.
- Discriminator/ Predictor Phase: The discriminator (D) evaluates proposed structures for "drug-likeness." Concurrently, a separate predictor model (often a graph neural network) estimates the compound's activity against the target.
- Reinforcement Learning Optimization: The generator is rewarded for producing molecules that "fool" the discriminator (appear drug-like) and score high on predicted activity. This loop iterates thousands of times.
- Output & Ranking: The final generative run produces a library of 1,000-10,000 novel molecules, which are ranked by a composite score (activity, properties, synthesizability). Top 50-100 are recommended for in silico docking and synthesis.
Protocol: Exscientia's Centaur Design Cycle
Aim: To optimize a hit compound into a lead series with improved potency and ADMET properties.
- Initial Design: AI proposes an initial set of ~100-200 virtual compounds around a hit, exploring diverse regions of chemical space.
- Priority Ranking: AI ranks proposals based on multi-parameter optimization (potency, selectivity, PK, predicted clearance).
- Expert Review: Medicinal chemists review top-ranked proposals (e.g., top 20), applying synthetic feasibility and intellectual property considerations.
- Synthesis & Testing: A batch of 10-20 compounds is synthesized and tested in relevant biochemical/cell assays.
- Model Retraining: New experimental data is fed back into the AI models to improve their predictive accuracy for the next cycle.
- Iteration: Steps 1-5 repeat for typically 3-6 cycles until lead candidate criteria are met.
Table 2: Quantitative Output Comparison (Representative Public Data)
| Platform | Key Metric | Reported Performance / Output |
|---|---|---|
| Insilico Medicine | Discovery Timeline (Preclinical Candidate) | ~30 months from target selection to PCC nomination (ISM001-055, fibrosis target) |
| Recursion | Experimental Scale | Maps >10 billion cellular images to >50 trillion inferred biological relationships |
| Exscientia | Synthesis Efficiency | Claims 1/4th the number of synthesized compounds vs. traditional HTS to identify a candidate |
| BenevolentAI | Target Prediction Validation | In a blinded study, identified 4 known drug targets for ALS from 20 AI-predicted targets |
| Relay Therapeutics | Lead Optimization (SHP2 inhibitor) | Advanced from hit to clinical candidate (RLY-1971) in ~24 months |
Visualizing Workflows & Signaling Pathways
Diagram 1: Recursion's Phenotypic AI Screening Workflow
Diagram 2: Insilico's Generative Chemistry AI Cycle
The Scientist's Toolkit: Key Research Reagent Solutions
Table 3: Essential Materials for AI-Integrated Drug Discovery Experiments
| Item / Reagent | Function in AI-Driven Workflow | Example Vendor/Technology |
|---|---|---|
| Engineered Cell Lines | Provide consistent, disease-relevant models for phenotypic screening (e.g., Recursion) or target validation. | Horizon Discovery, ATCC, in-house CRISPR engineering. |
| High-Content Screening (HCS) Kits | Fluorescent dyes/antibodies for multiplexed staining of cellular components (nuclei, actin, mitochondria, etc.) to generate rich imaging data. | Thermo Fisher (CellMask, MitoTracker), Abcam antibodies. |
| Automated Liquid Handlers | Enable reproducible, large-scale compound transfers and cell seeding for the massive experiments required to train AI models. | Beckman Coulter Biomek, Hamilton STAR. |
| Microscopy Systems | High-throughput confocal imagers to capture the high-resolution, multi-channel images used as primary data for phenotypic AI. | PerkinElmer Operetta/Opera, Molecular Devices ImageXpress. |
| Chemical Building Blocks | Diverse, high-quality fragments and intermediates for the rapid synthesis of AI-designed molecules (e.g., Exscientia, Insilico cycles). | Enamine, WuXi AppTec, Sigma-Aldrich. |
| Cryo-Electron Microscopy | Provides high-resolution protein structures for dynamics-based platforms (e.g., Relay) and structure-based AI design. | Thermo Fisher Glacios/Krios. |
| Multiplexed Assay Kits | Measure multiple biochemical or phenotypic endpoints (e.g., cell health, phosphorylation) to generate rich training data for predictor models. | Promega (CellTiter-Glo), Meso Scale Discovery (MSD) assays. |
Within the accelerating convergence of artificial intelligence (AI) and biotechnology, the validation of computational predictions stands as the critical bottleneck. Moving from in silico discovery to clinically relevant biological insight necessitates robust validation frameworks. These frameworks are predominantly structured around two core study paradigms: prospective and retrospective. This guide provides a technical analysis of these approaches and underscores the indispensable role of iterative wet-lab collaboration in building credible, translational AI-bio models.
Defining the Paradigms: Prospective vs. Retrospective Validation
Prospective Validation involves generating a novel AI-driven hypothesis (e.g., a new drug target, biomarker, or compound) and subsequently designing and executing a de novo experimental campaign to test it. The validation data did not exist prior to the prediction.
Retrospective Validation utilizes existing, previously generated datasets (e.g., public omics repositories, historical high-throughput screening data) to test an AI model's predictions. The model is evaluated on data it was not trained on, but which was collected independently.
Table 1: Comparative Analysis of Prospective vs. Retrospective Validation
| Aspect | Prospective Validation | Retrospective Validation |
|---|---|---|
| Temporal Relationship | Experiments conducted after model prediction. | Uses data generated before model prediction. |
| Gold Standard | Considered the highest level of evidence for translational research. | Provides preliminary evidence; subject to cohort/study bias. |
| Cost & Duration | High cost and long timeline (months to years). | Relatively low cost and fast (days to weeks). |
| Experimental Control | Full control over experimental design, protocols, and controls. | No control over original data generation; quality variable. |
| Risk | High risk of negative or inconclusive results. | Lower risk; used for initial feasibility and model tuning. |
| Primary Role | Confirmatory, decisive validation for publication and investment. | Exploratory analysis, model benchmarking, hypothesis generation. |
Experimental Protocols for Key Validation Studies
Protocol 3.1: Prospective Validation of an AI-Predicted Kinase Inhibitor
Objective: To validate the efficacy and specificity of a novel small-molecule kinase inhibitor identified by a generative AI model.
Materials: Target kinase protein (purified), putative AI-generated compound (and analogs), known active/inactive control compounds, ATP, peptide substrate, ADP-Glo Kinase Assay kit, appropriate cell lines.
Methodology:
- In Vitro Kinase Activity Assay: Perform a biochemical kinase assay using the ADP-Glo luminescence system.
- Serially dilute the AI-predicted compound and controls.
- Incubate kinase with substrate and ATP in the presence of compounds.
- Measure generated ADP via luminescence. Calculate IC₅₀ values.
- Selectivity Profiling: Screen the compound against a panel of 50-100 diverse kinases (commercial services available) to determine kinase selectivity score (S(10)).
- Cellular Target Engagement: Utilize a cellular thermal shift assay (CETSA).
- Treat live cells with compound or DMSO.
- Heat cells at a gradient of temperatures.
- Lyse cells and quantify remaining soluble target kinase via Western blot or quantitative mass spectrometry.
- Functional Phenotypic Assay: Measure downstream effects (e.g., phosphorylation of downstream substrates via phospho-flow cytometry, inhibition of proliferation in relevant cancer cell lines).
Protocol 3.2: Retrospective Validation of a Prognostic Biomarker Signature
Objective: To validate an AI-derived multi-gene RNA expression signature for predicting patient survival using independent public datasets.
Materials: Access to curated public genomic databases (e.g., TCGA, GEO, ArrayExpress). Statistical computing environment (R/Python).
Methodology:
- Data Curation: Identify 3-5 independent cohorts with RNA-seq/microarray data and overall survival (OS) information for the relevant cancer type.
- Signature Application: Apply the pre-defined algorithm (e.g., a linear combination of gene expression values) to calculate a risk score for each patient in the external cohorts.
- Stratification: Dichotomize patients into "high-risk" and "low-risk" groups based on the median risk score or an optimized cut-point.
- Statistical Analysis:
- Perform Kaplan-Meier survival analysis and log-rank test to compare OS between groups.
- Calculate hazard ratios (HR) using univariate and multivariate Cox proportional-hazards models (adjusting for age, stage, etc.).
- Assess predictive performance via time-dependent Receiver Operating Characteristic (ROC) analysis (e.g., concordance index).
The Collaborative Cycle: Integrating AI with Wet-Lab Biology
Effective validation requires a closed-loop, iterative partnership between computational and experimental scientists.
Diagram 1: The AI-Bio Validation Cycle (100 chars)
The Scientist's Toolkit: Key Research Reagent Solutions
Table 2: Essential Materials for AI-Driven Validation Experiments
| Reagent / Material | Function in Validation | Example Vendor/Kit |
|---|---|---|
| Recombinant Purified Proteins | Target for in vitro biochemical assays (e.g., kinase, binding assays). | Sino Biological, BPS Bioscience |
| Validated Antibodies (Phospho-specific) | Detect post-translational modifications & target engagement in cellular assays (WB, IF). | Cell Signaling Technology |
| Proliferation/Cytotoxicity Assay Kits (MTT, CellTiter-Glo) | Measure phenotypic response to predicted compounds in cell lines. | Promega |
| CRISPR/Cas9 Knockout Pooled Libraries | Functionally validate AI-predicted essential genes or synthetic lethal pairs. | Horizon Discovery |
| High-Content Imaging Systems & Dyes | Quantify complex morphological phenotypes from perturbation experiments. | Molecular Devices, Thermo Fisher |
| ADP-Glo, LanthaScreen Eu | Homogeneous, high-sensitivity biochemical assays for enzyme activity. | Promega, Thermo Fisher |
| CETSA Kits | Confirm cellular target engagement of small molecule predictions. | Proteintech, commercial MS services |
| Multiplex Immunoassay Panels (Luminex, MSD) | Validate multi-analyte biomarker signatures from patient data predictions. | Luminex Corporation, Meso Scale Discovery |
Pathway Visualization: Validating an AI-Predicted Oncogenic Pathway
Diagram 2: Experimental Workflow for Pathway Validation (94 chars)
In the integrated landscape of AI and biotechnology, validation is not a single step but a framework governed by complementary study types. Retrospective studies provide a necessary, efficient filter, while prospective studies deliver the definitive evidence required for translation. This framework's power is fully realized only through a deeply collaborative, cyclical partnership between computational and experimental biologists, where each wet-lab result feeds back to refine the next generation of AI models, driving a virtuous cycle of discovery.
The convergence of Artificial Intelligence (AI) and biotechnology is fundamentally reshaping the research and development (R&D) landscape. This transformation is most evident within the pharmaceutical and biotech sectors, where the traditional, high-cost, high-risk R&D pipeline is being streamlined through intelligent automation, predictive modeling, and data-driven decision-making. This guide provides a technical framework for quantifying the resulting return on investment (ROI) and operational efficiency gains, a core component of any thesis examining the AI-biotech convergence.
Quantifying the Traditional R&D Burden
The conventional drug discovery pipeline is characterized by immense costs, lengthy timelines, and high attrition rates. Recent data (2023-2024) underscores the scale of this challenge.
Table 1: Key Metrics of Traditional vs. AI-Augmented Drug Discovery
| Metric | Traditional Pipeline (Industry Average) | AI-Augmented Pipeline (Reported Gains) | Data Source & Year |
|---|---|---|---|
| Average Cost per New Drug | ~$2.3 Billion | Estimated 25-40% reduction in pre-clinical costs | [DiMasi et al., JHE 2023]; Industry Reports 2024 |
| Discovery to Pre-Clinical Timeline | 4-6 years | Reduced by 1.5-3 years (~30-50%) | [Nature Reviews Drug Discovery, 2024] |
| Clinical Trial Success Rate (Phase I to Approval) | ~7.9% | Predictive AI models aim to improve selection, potential to increase by >10% points | [BIO, Informa Pharma Intelligence 2023] |
| Compound Attrition Rate (Pre-Clinical) | >90% | AI-driven target & lead optimization can reduce by ~20-30% | [McKinsey Analysis, 2024] |
| High-Throughput Screening (HTS) Hit Rate | 0.01%-0.1% | ML-prioritized libraries report hit rates of 1-5% | [Recent AI-Biotech Publications, 2023-24] |
Methodological Framework for Quantifying Gains
A rigorous cost-benefit analysis requires the implementation of specific, measurable experimental protocols comparing traditional and AI-enhanced workflows.
Experimental Protocol: Target Identification & Validation
A. Traditional Protocol (Control Arm):
- Hypothesis Generation: Literature review and genomic association studies (e.g., GWAS) to identify a disease-linked target.
- In Vitro Validation: Knockdown/knockout of target gene in relevant cell lines using siRNA/CRISPR-Cas9.
- Functional Assays: Measure phenotypic changes (e.g., proliferation, apoptosis, biomarker secretion) via ELISA, flow cytometry.
- Animal Model Validation: Develop transgenic or xenograft models to confirm target's role in vivo.
- Duration: 18-24 months. Cost: $3-5M.
B. AI-Augmented Protocol (Experimental Arm):
- Data Aggregation: Integrate multi-omic datasets (genomics, transcriptomics, proteomics) from public repositories (TCGA, GTEx, UK Biobank) and proprietary sources.
- AI-Driven Target Prioritization: Use graph neural networks (GNNs) to model biological networks, identifying central, druggable nodes. Employ natural language processing (NLP) on scientific literature to uncover latent associations.
- In Silico Validation: Perform systems biology simulations to predict knockdown consequences and potential side-effects (off-target) networks.
- Focused Experimental Validation: Proceed only with top-ranked, computationally validated targets to wet-lab assays (Steps A.2-A.4).
- Duration: 6-9 months. Cost: $1-2M (including compute and data curation).
Experimental Protocol: Lead Compound Discovery
A. Traditional Protocol (HTS):
- Assay Development: Design a biochemical or cell-based assay for the validated target.
- Library Screening: Screen >1 million compounds from a diverse chemical library.
- Hit Identification: Apply statistical thresholds (e.g., Z-score > 3) to identify "hits."
- Hit-to-Lead: Medicinal chemistry optimization of ~50-100 hits through iterative synthesis and testing cycles.
- Duration: 24-36 months. Cost: $10-15M.
B. AI-Augmented Protocol (Virtual Screening & Generative Chemistry):
- Assay Development & Data Preparation: Develop a primary assay. Use historical HTS data and published bioactivity data to train a model.
- Structure-Based Virtual Screening: If a 3D target structure is available, use deep learning docking models (e.g., EquiBind, DiffDock) to screen ultra-large virtual libraries (billions of molecules).
- Generative AI Design: Use generative adversarial networks (GANs) or variational autoencoders (VAEs) conditioned on the target's active site to de novo design novel molecules with optimal properties.
- Synthesis & Testing: Synthesize and test only the top 100-200 in silico prioritized or generated compounds.
- Duration: 9-12 months. Cost: $2-4M.
Visualization of AI-Augmented R&D Workflows
Diagram Title: AI vs Traditional Drug Discovery Workflow
Diagram Title: ROI Calculation Logic for AI R&D
The Scientist's Toolkit: Key Research Reagent Solutions
Table 2: Essential Reagents & Platforms for AI-Biotech Experiments
| Item / Solution | Function in AI-Augmented Pipeline | Example Vendor/Platform (2024) |
|---|---|---|
| CRISPR-Cas9 Screening Libraries | High-throughput functional validation of AI-prioritized targets. Enables genetic perturbation at scale. | Synthego, Horizon Discovery |
| Phospho-/Total Proteomic Kits | Generate high-dimensional data for AI model training and validation of target engagement and signaling effects. | Olink Explore, IsoPlexis |
| AI-Optimized Compound Libraries | Chemically diverse, synthesizable libraries designed for machine learning readiness (e.g., with computed descriptors). | Enamine REAL Space, WuXi LabNetwork |
| Cloud Lab Notebooks & Data Platforms | Secure, structured data capture essential for training and auditing AI models. Integrates with analysis tools. | Benchling, TetraScience |
| Predicted 3D Protein Structures | High-accuracy structural data for structure-based AI design when experimental structures are unavailable. | AlphaFold DB (EMBL-EBI), ESMFold |
| Single-Cell Multi-omics Kits | Uncover disease heterogeneity and candidate biomarkers, providing rich data for predictive models. | 10x Genomics Chromium, Parse Biosciences |
| Automated Synthesis & Assay Platforms | Rapidly iterate on AI-generated compound designs, closing the "design-make-test-analyze" loop. | Strateos, Emerald Cloud Lab |
The convergence of artificial intelligence (AI) and biotechnology is redefining precision medicine. Central to this paradigm shift is the development of AI-derived biomarkers—complex, multidimensional signatures extracted from high-throughput multimodal data—and their clinical validation through patient-specific digital twins. This whitepaper details the technical frameworks and experimental protocols essential for advancing this frontier, targeting robust patient stratification in therapeutic development.
Core Technical Framework: From Data to Digital Twin
The pipeline for creating and validating AI-derived biomarkers involves sequential, interdependent phases.
Data Acquisition & Multimodal Integration
AI-derived biomarkers necessitate integration of diverse data modalities. The following table summarizes primary data sources and their contributions.
Table 1: Multimodal Data Sources for AI Biomarker Development
| Data Modality | Example Sources | Typical Volume per Patient | Key Extracted Features |
|---|---|---|---|
| Genomics | Whole Genome Sequencing (WGS), Targeted Panels | 80-100 GB (WGS) | Single Nucleotide Variants (SNVs), Copy Number Variations (CNVs), Structural Variants |
| Transcriptomics | Bulk RNA-Seq, Single-Cell RNA-Seq | 10-30 GB (scRNA-Seq) | Gene Expression Matrices, Differential Expression, Cell Type Proportions |
| Proteomics | Mass Spectrometry, Olink Assays | 1-5 GB | Protein Abundance, Post-Translational Modifications |
| Medical Imaging | MRI, CT, Whole Slide Imaging (Digital Pathology) | 50 MB - 5 GB | Radiomic Features (Texture, Shape), Deep Learning Embeddings |
| Clinical & Wearable Data | EHRs, Continuous Glucose Monitors, Actigraphy | 10 MB - 1 GB/day | Vital Sign Trends, Disease Scores, Behavioral Patterns |
AI Biomarker Derivation: Algorithmic Approaches
Biomarkers are derived using supervised, unsupervised, or semi-supervised learning on integrated data.
Key Experimental Protocol: Multimodal Deep Learning for Prognostic Signature Identification
- Objective: To develop a survival risk stratification biomarker from paired genomic, imaging, and clinical data.
- Methodology:
- Data Preprocessing: Genomic data is encoded as mutation matrices and gene expression vectors. Imaging data is processed via a pre-trained convolutional neural network (CNN) to extract a 1024-dimensional feature vector. Clinical variables are normalized.
- Model Architecture: A hybrid neural network with separate encoders for each modality is used. Encoder outputs are fused via cross-modal attention.
- Training: The model is trained using a combined loss function: Cox proportional hazards loss for survival prediction and contrastive loss to ensure modality alignment.
- Signature Extraction: The activations from the network's final latent layer prior to the prediction head are used as the patient's AI-derived biomarker vector.
- Validation: Performance is assessed via time-dependent Area Under the Curve (AUC) and concordance index (C-index) in held-out test and external validation cohorts.
Digital Twin Construction for In Silico Patient Stratification
A digital twin is a dynamic computational model that simulates disease progression and treatment response for an individual patient.
Key Experimental Protocol: Mechanistic-AI Hybrid Digital Twin for Cancer
- Objective: To create a patient-specific model predicting tumor response to combination therapy.
- Methodology:
- Foundation: A core mechanistic model (e.g., system of ordinary differential equations) representing tumor-immune-drug interactions is instantiated.
- Personalization: Patient-specific parameters (e.g., tumor growth rate, immune cell infiltration score from the AI biomarker) are estimated by fitting the model to the patient's historical data using Bayesian inference.
- Simulation & Stratification: The personalized model is used to simulate response to various therapeutic regimens. Patients are stratified into "responder" and "non-responder" cohorts based on simulated tumor burden reduction thresholds (e.g., >30% reduction at 12 weeks).
AI and Digital Twin Integration Workflow
Clinical Validation Protocols
Validation moves from retrospective analysis to prospective clinical trial integration.
Table 2: Clinical Validation Stages for AI-Derived Biomarkers
| Stage | Study Design | Primary Endpoint | Key Statistical Consideration |
|---|---|---|---|
| Retrospective Analytical Validation | Case-control or cohort study using archived biospecimens and data. | Analytical performance (Sensitivity, Specificity, AUC). | Adjustment for batch effects and confounding variables. |
| Retrospective Clinical Validation | Analysis of data from completed clinical trials (e.g., basket trials). | Association with clinical outcome (Hazard Ratio, C-index). | Pre-specified statistical analysis plan to avoid data dredging. |
| Prospective Clinical Validation | Prospective observational study measuring biomarker in real-time. | Time-to-event or diagnostic accuracy compared to standard of care. | Power calculation based on expected effect size from retrospective data. |
| Prospective Interventional (RCT) | Biomarker-stratified randomized controlled trial. | Difference in treatment effect between biomarker-positive and -negative arms. | Blinding of biomarker assignment and analysis. |
Key Experimental Protocol: Blinded Retrospective Re-analysis of Phase III Trial Data
- Objective: To validate a digital twin-predicted responder index against overall survival (OS) data.
- Methodology:
- Data Lock & Blinding: Obtain locked datasets (imaging, genomics, outcomes) from a completed Phase III trial. The biomarker team is blinded to treatment arm assignments and patient outcomes.
- Biomarker Application: Apply the pre-trained AI biomarker model and digital twin simulator to each patient's baseline data to generate a predicted "benefit score."
- Statistical Analysis: Unblinding occurs after scores are generated. The pre-specified analysis tests the interaction between the treatment arm and the continuous benefit score on OS using a Cox model. A significant interaction (p < 0.05) supports the biomarker's predictive value.
Blinded Retrospective Validation Protocol
The Scientist's Toolkit: Research Reagent Solutions
Table 3: Essential Resources for AI Biomarker & Digital Twin Research
| Item / Solution | Provider Examples | Function in Research |
|---|---|---|
| Multimodal Data Biobanks | UK Biobank, The Cancer Genome Atlas (TCGA), All of Us | Provide large-scale, clinically annotated datasets essential for training and initial validation of AI models. |
| Cloud Genomics Platforms | Google Cloud Life Sciences, AWS HealthOmics, DNAnexus | Offer scalable compute and pre-configured pipelines for processing genomic and transcriptomic data. |
| Biomedical AI Model Hubs | NVIDIA Clara, MONAI Model Zoo, Hugging Face (BioMed) | Provide pre-trained, state-of-the-art models (e.g., for pathology image analysis) for transfer learning and benchmarking. |
| Mechanistic Modeling Suites | MATLAB SimBiology, COPASI, Tellurium | Enable construction, simulation, and parameter estimation for the core biological models used in digital twins. |
| Federated Learning Frameworks | NVIDIA FLARE, OpenFL, Substra | Allow training of AI biomarker models across multiple institutions without sharing raw patient data, addressing privacy. |
| Clinical Trial Simulation Software | R clinicalsimulation package, SAS simplan |
Facilitate the design of prospective biomarker-stratified trials by simulating power and patient recruitment. |
Signaling Pathway Analysis via AI Biomarkers
AI can deconvolve complex pathway activities from bulk omics data, a key input for digital twin personalization.
AI Inference of Key Signaling Pathway Activity
The clinical validation of AI-derived biomarkers and digital twins represents a foundational challenge in the AI-biotechnology convergence thesis. Success requires rigorous, multi-stage validation protocols, transparent methodologies, and close collaboration between computational scientists, biologists, and clinical trialists. By adhering to the technical frameworks outlined herein, researchers can translate these advanced computational tools into robust, clinically actionable stratification strategies that accelerate drug development and personalize patient care.
Conclusion
The convergence of AI and biotechnology has fundamentally shifted the paradigm of biomedical research, moving from a primarily hypothesis-driven to a data-driven, predictive science. From foundational generative models creating novel therapeutics to robust frameworks for validating their efficacy, this synergy promises unprecedented acceleration in drug development. However, realizing its full potential requires continued focus on solving critical challenges in data quality, model transparency, and clinical translation. The future lies in deeply integrated, collaborative platforms where AI not only proposes candidates but also actively learns from iterative experimental and clinical feedback. For researchers and drug developers, mastery of this interdisciplinary landscape is no longer optional but essential for leading the next wave of precision medicine and delivering transformative therapies to patients faster and more efficiently.