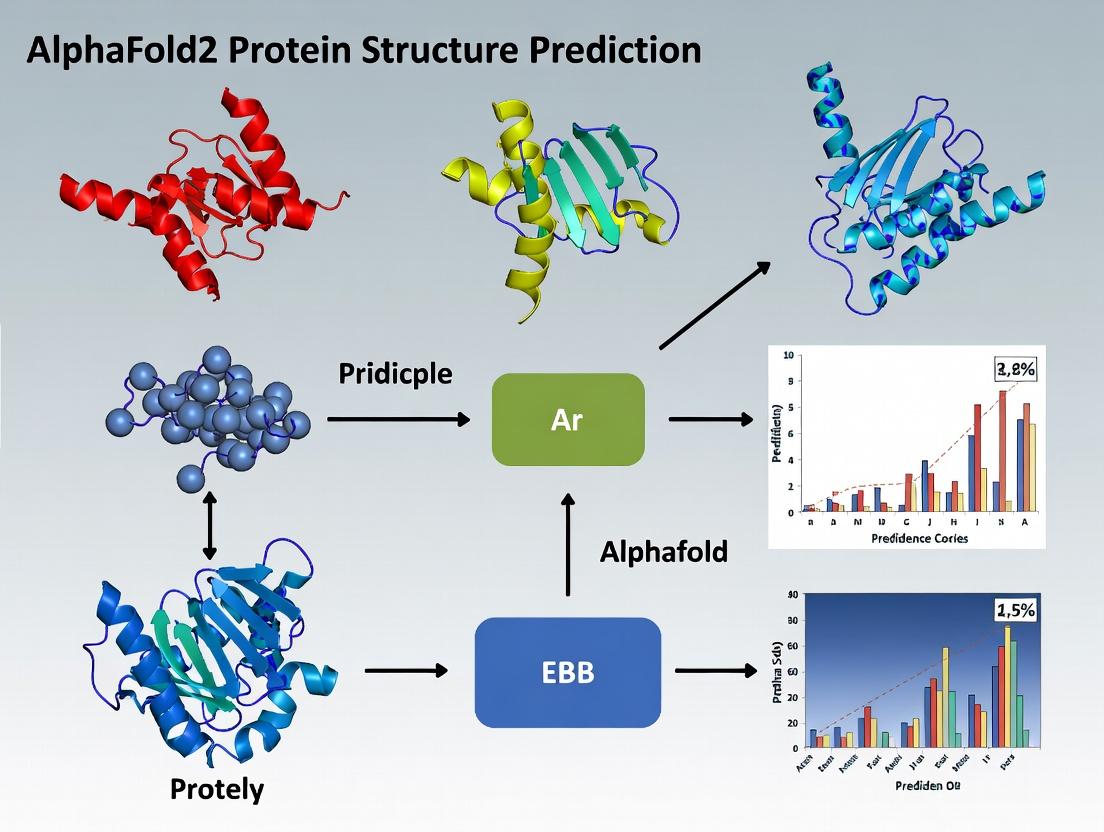
Decoding AlphaFold2: The AI Revolution in Protein Structure Prediction Explained
This article provides a comprehensive technical analysis of AlphaFold2, DeepMind's groundbreaking AI system.
Decoding AlphaFold2: The AI Revolution in Protein Structure Prediction Explained
Abstract
This article provides a comprehensive technical analysis of AlphaFold2, DeepMind's groundbreaking AI system. It explains the foundational principles of its architecture, details its methodology and diverse applications in biomedical research, addresses common challenges and optimization strategies for users, and validates its performance against experimental and computational benchmarks. Designed for researchers, scientists, and drug development professionals, this guide bridges the gap between theoretical understanding and practical application in structural biology.
Unraveling the Core Architecture: How AlphaFold2's Neural Networks Master Protein Folding
The "protein folding problem"—predicting a protein's three-dimensional structure from its amino acid sequence—has been a fundamental grand challenge in molecular biology for over 50 years. The inability to reliably predict structure from sequence severely limited our understanding of biological function and hindered rational drug design. This whitepaper frames the solution within the broader thesis of AlphaFold2's revolutionary deep learning architecture, which has provided atomic-level accuracy, effectively resolving the core of this long-standing problem for a vast array of proteins.
Core Principles of AlphaFold2
AlphaFold2, developed by DeepMind, represents a paradigm shift from physical or homology-based modeling to an end-to-end deep learning approach. Its core innovation is the integrated use of:
- Evolutionary Sequence Analysis: Construction of a Multiple Sequence Alignment (MSA) and extraction of co-evolutionary signals.
- Template Modeling: Leveraging known protein structures from the PDB (Protein Data Bank).
- Geometric Deep Learning: A novel Evoformer neural network module that processes the MSA and pairwise representations, followed by a Structure Module that iteratively refines 3D atomic coordinates.
Detailed Methodological Framework
Input Preprocessing and Feature Engineering
Protocol: For a target sequence of length N.
- MSA Construction: Search the target sequence against large sequence databases (e.g., UniRef, BFD, MGnify) using HHblits and JackHMMER. Output is an MSA of size S × N.
- Template Search: Use HHSearch to find homologous structures in the PDB. Extract features (torsion angles, distances) from up to top 4 templates.
- Feature Compilation: Compile into arrays:
- MSA representation:
[S, N, 23](22 amino acids + gap) - Pairwise representation:
[N, N, C](includes features like residue separation, predicted distance distributions from trRosetta, etc.) - Template information:
[N, N, C_t]
- MSA representation:
Neural Network Architecture: Evoformer & Structure Module
Experimental/Computational Protocol:
- Evoformer Processing: The MSA and pairwise representations are passed through 48 stacked Evoformer blocks. Each block performs attention operations:
- MSA-row wise gated self-attention: Updates sequences in the MSA based on other residues in the same sequence.
- MSA-column wise attention: Updates residues based on other sequences in the same column, capturing evolutionary relationships.
- Outer product mean: Transfers information from the MSA representation to the pairwise representation.
- Triangular multiplicative updates (outgoing & incoming): Allows residues to communicate via their mutual relationships with a third residue, enforcing geometric consistency.
- Triangular self-attention: Updates the pairwise representation.
- Structure Module: Processes the refined pairwise representation through 8 structure blocks.
- It represents the protein as a rigid-body framework of frames (orientations) per residue.
- Iteratively refines backbone frames and side-chain conformations (
χangles). - Directly predicts atomic coordinates for all heavy atoms.
- Uses a "distillation" step of structure self-distillation on earlier network versions to improve accuracy.
Loss Function and Training
Protocol: The network is trained to minimize a composite loss function:
- FAPE (Frame Aligned Point Error): Measures error between predicted and true atomic positions in local residue frames.
- Distogram Loss: Cross-entropy loss on predicted binned distances between Cβ atoms.
- Violation Loss: Penalizes steric clashes and incorrect bond geometry.
- TM-Score Loss: Encourages predictions with high TM-score (global fold measure).
Table 1: AlphaFold2 Performance Metrics (CASP14)
| Metric | AlphaFold2 Median Score | Previous State-of-the-Art (CASP13) | Significance |
|---|---|---|---|
| GDT_TS (Global Distance Test) | 92.4 | ~60 (Top CASP13 group) | >90 GDT_TS is considered competitive with experimental accuracy. |
| RMSD (Backbone) for easy targets | ~1 Å | ~3-5 Å | Near-atomic accuracy achieved. |
| TM-score | >0.9 for most targets | ~0.7-0.8 | >0.9 indicates highly correct topology. |
Key Signaling and Data Flow in AlphaFold2
Diagram 1: AlphaFold2 End-to-End Prediction Workflow (71 chars)
Diagram 2: Data Flow within an Evoformer Block (57 chars)
Table 2: Key Resources for AlphaFold2-Inspired Research
| Item / Resource | Function / Purpose | Example / Source |
|---|---|---|
| AlphaFold2 Code & Weights | Pre-trained model for structure prediction. | Available via DeepMind GitHub and Colab notebooks. |
| AlphaFold Protein Structure Database | Pre-computed predictions for 200+ million proteins. | EMBL-EBI (https://alphafold.ebi.ac.uk) |
| Multiple Sequence Alignment (MSA) Tools | Generate evolutionary co-variance data. | HHblits (Uniclust30), JackHMMER (MGnify), MMseqs2 (fast search). |
| Template Search Tools | Identify structural homologs for input features. | HHSearch (against PDB70 database). |
| Structure Evaluation Metrics | Quantify prediction accuracy. | RMSD, GDT_TS, TM-score, lDDT (local Distance Difference Test). |
| Molecular Visualization Software | Visualize and analyze predicted 3D structures. | PyMOL, ChimeraX, UCSF Chimera. |
| Molecular Dynamics (MD) Software | Refine and validate predicted structures, simulate dynamics. | GROMACS, AMBER, CHARMM, NAMD. |
| Specialized Compute Hardware | Accelerate training and inference of large models. | GPU clusters (NVIDIA A100/V100), TPU pods (for large-scale training). |
This whitepaper situates itself within a broader thesis research on the principles underlying AlphaFold2's revolutionary protein structure prediction capability. The transition from AlphaFold to AlphaFold2 represents not merely an incremental improvement but a paradigm shift in computational biology, moving from physical scoring and residue co-evolution analysis to an end-to-end deep learning architecture that directly predicts 3D atomic coordinates. Understanding this evolution is critical for researchers and drug development professionals aiming to leverage or build upon these foundational models.
Evolutionary Trajectory: Core Architectural Shifts
The fundamental leap from AlphaFold (2018) to AlphaFold2 (2020) lies in abandoning the traditional pipeline for a fully differentiable, attention-based system.
AlphaFold (v1, CASP13):
- Core Principle: A hybrid system combining deep learning with physical geometry.
- Method: Used a convolutional neural network (CNN) to predict distributions over distances between amino acid pairs (distograms) and angles between chemical bonds. These predictions were then used as restraints in a gradient descent-based scoring and optimization procedure to construct a 3D model.
- Limitation: The process was not end-to-end; the final structure was not a direct neural network output but the result of a separate optimization.
AlphaFold2 (v2, CASP14):
- Core Principle: An end-to-end deep learning transformer architecture.
- Method: Introduced the Evoformer (a novel attention-based module) and the Structure Module. The system directly outputs a full 3D atomic structure (including side chains) for a given protein sequence and its multiple sequence alignment (MSA). It uses an SE(3)-equivariant transformer to iteratively refine the structure, ensuring 3D rotational and translational symmetry.
Quantitative Performance Comparison
Table 1: Key Performance Metrics at CASP Competitions
| Metric | AlphaFold (CASP13, 2018) | AlphaFold2 (CASP14, 2020) |
|---|---|---|
| Global Distance Test (GDT_TS)Median Score (on free modeling targets) | 58.0 | 87.0 |
| Root-Mean-Square Deviation (RMSD) | Higher (~3-5 Å for many targets) | Significantly Lower (~1-2 Å for many targets) |
| Performance Leap | State-of-the-art at time, outperforming all others. | Achieved accuracy competitive with experimental methods (e.g., X-ray crystallography). |
| Key Architectural Differentiator | Distance geometry + optimization | End-to-end SE(3)-equivariant transformer |
Table 2: Model Input & Output Specifications
| Component | AlphaFold | AlphaFold2 |
|---|---|---|
| Primary Input | Protein Sequence + MSA | Protein Sequence + MSA + Templates (optional) |
| Core Neural Network | Convolutional Neural Networks (CNNs) | Evoformer (Attention) + Structure Module |
| Primary Output | Distograms, Angle Distributions | Full 3D Coordinates (backbone & side chains) |
| Confidence Metric | Predicted Local Distance Difference Test (pLDDT) | pLDDT per residue + Predicted Aligned Error (PAE) for pairs |
Detailed Methodology of the AlphaFold2 System
Experimental/Inference Protocol:
Input Preparation:
- Sequence: The target amino acid sequence is provided.
- Multiple Sequence Alignment (MSA): The sequence is searched against large genomic databases (e.g., UniRef, BFD) using tools like HHblits or JackHMMER to generate an MSA. This provides evolutionary context.
- Templates (Optional): Structurally homologous proteins are identified from the PDB using search tools.
Embedding Generation (Input Processing):
- The raw sequence, MSA, and templates are embedded into initial feature representations (pairwise and MSA representations).
Evoformer Processing:
- The embeddings are passed through the Evoformer stack, a series of identical blocks that apply attention mechanisms.
- It performs information exchange between the MSA representation (residue vs. sequence) and the pair representation (residue vs. residue).
- Outcome: A refined pair representation that encapsulates both evolutionary and potential structural coupling information.
Structure Module Execution:
- The refined pair representation is passed to the Structure Module.
- This module operates on a set of latent "residue tokens." It uses an SE(3)-equivariant transformer to iteratively (over several cycles) predict the 3D coordinates of all heavy atoms for each residue.
- The process is "structure-aware" from the start, with each update being equivariant to rotations and translations.
Output and Recycling:
- The final 3D atomic coordinates are output. The model also outputs a per-residue confidence score (pLDDT) and a pairwise confidence metric (Predicted Aligned Error, PAE).
- A key innovation is "recycling": The outputs (coordinates) are fed back as additional inputs to the embedding stage for several iterations (typically 3-4), allowing the model to self-correct.
System Architecture & Workflow Diagrams
Diagram 1: AlphaFold2 End-to-End Inference Pipeline
Diagram 2: Evoformer Stack Information Flow
The Scientist's Toolkit: Research Reagent Solutions
Table 3: Essential Resources for AlphaFold2-Based Research
| Item / Solution | Function / Purpose | Source / Example |
|---|---|---|
| Protein Sequence Database | Source of target amino acid sequences for prediction. | UniProt, NCBI Protein |
| Genomic Databases for MSA | Provides evolutionary context via homologous sequences. Critical input. | UniRef90/UniRef30, Big Fantastic Database (BFD), MGnify |
| MSA Generation Tool | Software to search sequence against genomic databases. | HH-suite3 (HHblits), JackHMMER (HMMER suite) |
| Template Search Database | Source of known protein structures for optional template input. | Protein Data Bank (PDB), PDB70 (HH-suite formatted) |
| AlphaFold2 Code & Weights | The pre-trained model for structure inference. | GitHub: DeepMind/alphafold (Open Source), ColabFold |
| Computational Environment | Hardware/Software to run the model (significant GPU memory required). | NVIDIA GPUs (A100/V100), Docker, CUDA, Python |
| ColabFold | Streamlined, faster implementation of AlphaFold2 using MMseqs2 for MSA. | GitHub: sokrypton/ColabFold |
| Predicted Aligned Error (PAE) Plot | Visualization tool for interpreting inter-domain confidence and flexibility. | Output from AlphaFold2, visualized in PyMOL/ChimeraX |
| pLDDT Per-Residue Score | Confidence metric (0-100) for the reliability of each residue's predicted local structure. | Direct model output, crucial for assessing prediction quality. |
Within the paradigm-shifting AlphaFold2 system, the Evoformer and Structure Module constitute the synergistic architectural core that translates evolutionary sequence information into accurate atomic coordinates. This in-depth technical guide examines their operation within the broader thesis of end-to-end differentiable protein structure prediction.
The AlphaFold2 pipeline processes multiple sequence alignments (MSAs) and template features through a series of Evoformer blocks, building a rich, internal representation. This representation is then passed iteratively to the Structure Module, which directly predicts the 3D coordinates of all backbone and side-chain heavy atoms.
Diagram Title: AlphaFold2 Core Data Flow
The Evoformer: A Detailed Technical Examination
The Evoformer operates on two primary representations: the MSA representation (s × r × cm) for s sequences and r residues, and the pair representation (r × r × cz). Its innovation lies in the bidirectional flow of information between these two data structures via attention mechanisms.
Core Evoformer Operations
- MSA-row wise gated self-attention: Updates each row of the MSA representation independently.
- MSA-column wise gated self-attention: Enables communication between residues across sequences.
- Outer Product Mean: A key operation that communicates from the MSA representation to the pair representation, effectively averaging over the sequence dimension.
- Triangular multiplicative update: A computationally efficient method for pair representation nodes to incorporate information from their neighboring residues, enforcing geometric constraints.
- Triangular self-attention: Operates on the pair representation, considering incoming and outgoing edges separately to model residue-pair relationships.
Quantitative Performance Impact of Evoformer Ablations
Based on AlphaFold2 ablation studies (Jumper et al., Nature 2021).
Table: Impact of Evoformer Component Ablation on Prediction Accuracy
The Structure Module: From Representations to 3D Coordinates
The Structure Module is a physics-informed network that interprets the pair representation to construct a local, residue-frame system and predict atomic coordinates via iterative refinement.
Invariant Point Attention (IPA)
The central mechanism of the Structure Module is Invariant Point Attention (IPA). It is designed to be invariant to global rotations and translations, a critical property for 3D structure.
- Inputs: A set of latent points (from the backbone trace) and associated scalar features.
- Process: Attention weights are computed from scalar features. These weights are used to perform a weighted sum of spatial points, which are then rotated/translated into the local frame of the residue.
- Output: Updated scalar features and refined 3D point estimates.
Structure Module Workflow
Diagram Title: Structure Module Iterative Refinement Loop
Experimental Protocols for Validation
Protocol 1: Assessing Evoformer's Co-evolutionary Learning
Objective: Quantify the information flow from MSA to pairwise distances. Methodology:
- Train a modified AlphaFold2 with a gradient stop between the MSA and Pair representations.
- Compare the mutual information between the final pair representation and the input MSA against the unmodified model.
- Correlate the drop in mutual information with the decline in predicted distance accuracy on a held-out test set (e.g., PDB100). Key Measurement: Bits of co-evolutionary information retained per residue pair.
Protocol 2: Testing Structure Module's Physical Realism
Objective: Evaluate the stereochemical and energetic quality of predicted structures. Methodology:
- Generate predictions for 50 diverse, high-resolution (<2.0 Å) crystal structures from the PDB.
- Process predictions and ground truth through Rosetta's
refineprotocol to compute restraint energies. - Analyze backbone dihedral angles (Ramachandran plots) using MolProbity.
- Compare clash scores (atoms < 2.4 Å apart) between predictions and ground truth. Key Measurement: Z-score of predicted structure's restraint energy vs. native ensemble.
Quantitative Benchmarking on CASP14
Performance metrics for AlphaFold2's core components on the CASP14 free modeling targets.
Table: Component-Level Performance on CASP14 FM Targets
The Scientist's Toolkit: Research Reagent Solutions
| Item / Solution | Function in AlphaFold2 Research | Typical Provider / Implementation |
|---|---|---|
| MSA Generation (e.g., HHblits, Jackhmmer) | Creates the dense evolutionary sequence profile input for the Evoformer from a query sequence. | HMMER suite, UniRef, MGnify databases |
| Template Search (e.g., HHSearch) | Identifies potential structural homologs from the PDB to provide initial structural priors. | PDB70, HHSuite |
| Differentiable Geometry Library | Enables gradient-based learning on 3D rotations and translations within the Structure Module. | AlphaFold2's rigid_utils.py (Quaternion-based) |
| Frame-Aligned Point Error (FAPE) Loss | The primary training loss function; measures error in a local, invariant frame. | Custom loss function defined in Jumper et al. |
| Confidence Metric (pLDDT, PAE) | Predicts per-residue (pLDDT) and pairwise (PAE) confidence scores for model interpretation. | Integrated network heads in the final layer |
| Structure Relaxation (e.g., Amber) | Minimizes steric clashes and bond strain in final predicted coordinates using physical force fields. | OpenMM (Amber14 force field) in AlphaFold2 pipeline |
The revolutionary performance of AlphaFold2 in the 14th Critical Assessment of protein Structure Prediction (CASP14) is predicated on its novel neural network architecture, which ingeniously processes two primary streams of information: evolutionary relationships and known structural fragments. This whitepaper delves into the core input features—Multiple Sequence Alignments (MSAs) and structural templates—framing them as the foundational data layers that enable the Evoformer and structure modules to decode three-dimensional atomic coordinates. Understanding the generation, processing, and integration of MSAs and templates is critical for researchers aiming to adapt, extend, or critically evaluate deep learning-based protein structure prediction methodologies in fields ranging from basic biology to targeted drug development.
The Dual Pillars of Input: MSA and Templates
Multiple Sequence Alignment (MSA): The Evolutionary Blueprint
An MSA is a collection of homologous protein sequences aligned to maximize residue-level correspondence. It encodes evolutionary constraints; residues that co-vary across evolution suggest structural or functional proximity, providing powerful distance and contact clues.
Key Quantitative Metrics from Recent Studies (2023-2024):
Table 1: Impact of MSA Depth and Diversity on AlphaFold2 Prediction Accuracy (pLDDT > 90)
| Target Protein Class | Min. Effective Sequence Count (Neff) | Typical Homolog Search Database | Average pLDDT Improvement with Deep MSAs | Reference (Example) |
|---|---|---|---|---|
| Soluble Globular | > 100 | UniRef90, BFD, MGnify | +15 to +20 points | Nature Methods, 2023 |
| Membrane Proteins | > 50 | UniRef90 + specialized databases | +10 to +15 points | Sci. Adv., 2024 |
| Orphan Proteins (Low Homology) | < 30 | Custom metagenomic libraries | < 5 points (baseline challenge) | PNAS, 2023 |
| Protein Complexes | > 200 (per chain) | Complex-specific filtering | +10 points for interface accuracy | Elife, 2024 |
Structural Templates: The Fold Prior
Templates are experimentally solved structures (from PDB) of homologous proteins. AlphaFold2 uses them not as rigid scaffolds but as sources of pairwise distances and residue identities, injected as auxiliary information to guide folding, especially for targets with clear evolutionary relatives.
Table 2: Template-Based Guidance Efficacy in AlphaFold2
| Template Quality Metric | High-Quality Threshold | Contribution to Final Confidence (pLDDT) | Use Case Scenario |
|---|---|---|---|
| Sequence Identity to Target | > 40% | High (Primary guide) | Close homologs exist |
| Template Coverage | > 70% of target length | Moderate to High | Partial structural homology |
| Template Resolution | < 2.5 Å | High (More reliable distances) | High-fidelity prior |
Experimental Protocols for Data Generation
Protocol 3.1: Generating a Deep MSA for AlphaFold2 Input
This protocol outlines the standard pipeline used in recent benchmark studies.
Objective: Produce a deep, diverse MSA from major sequence databases. Materials: HMMER, HH-suite, computing cluster or cloud instance, target sequence in FASTA format. Databases: UniRef90, BFD/MGnify (for metagenomic sequences), and optionally, species-specific databases.
Procedure:
- Initial Search: Use
jackhmmer(HMMER) orhhblits(HH-suite) for iterative searches against UniRef90. Perform 3-5 iterations with an E-value cutoff of 1e-10. - Metagenomic Augmentation: Take the resulting profile and search with
hhblitsagainst the BFD or MGnify database. This step is crucial for capturing deep evolutionary signals. - Clustering and Filtering: Cluster sequences at 90% identity using
hhfilterorMMseqs2to reduce redundancy. Aim for an effective sequence count (Neff) > 100. - Format Conversion: Convert the final MSA to the A3M format required by AlphaFold2's data pipeline.
- Validation: Check MSA depth (number of sequences) and coverage (percentage of target sequence with aligned residues).
Protocol 3.2: Retrieving and Preparing Structural Templates
Objective: Identify and process potential structural templates from the PDB. Materials: Local copy of the PDB database, HMMER/HH-suite, or Foldseek for fast structural alignment. Software: HHSearch, MMseqs2 (with Foldseek module).
Procedure:
- Profile Creation: Build a hidden Markov model (HMM) profile from the MSA generated in Protocol 3.1.
- Database Search: Search the HMM profile against a database of PDB profiles using
hhsearch. Alternatively, usefoldseekfor a fast, structure-based search. - Hit Selection: Select templates based on a combination of: (a) E-value (< 1e-5), (b) sequence identity (> 20%), (c) query coverage (> 50%), and (d) alignment quality.
- Template Processing: Extract the relevant sequences and structural features (atoms for residues, distance maps) for each template hit.
- Feature Generation: Convert the template structures into the specific feature format used by AlphaFold2, including template torsion angles, distances, and mask.
Title: AlphaFold2 Input Feature Generation Workflow
Integration in the AlphaFold2 Architecture
The processed MSA (M rows x L columns) and template information (T templates x L residues) are embedded and fed into the Evoformer, the core attention-based module. The Evoformer performs information exchange between residues in the sequence and between sequences in the MSA, allowing evolutionary constraints and template-derived geometry to inform the emerging structural model.
Title: MSA and Template Data Flow in Evoformer
The Scientist's Toolkit: Research Reagent Solutions
Table 3: Essential Resources for MSA and Template-Based Research
| Tool/Resource Name | Type | Primary Function | Key Parameter to Optimize |
|---|---|---|---|
| HH-suite (HHblits/HHsearch) | Software Suite | Ultra-fast protein homology detection and MSA generation. | E-value threshold, number of iterations. |
| ColabFold (MMseqs2 API) | Web Server/Software | Streamlined, fast MSA generation and AlphaFold2/3 execution. | Pairing mode for complexes, sequence database selection. |
| PDB (Protein Data Bank) | Database | Primary repository for experimentally determined 3D structures. | Release date filter, resolution, and experimental method. |
| Foldseek | Software | Fast structural alignment and template search directly on 3D coordinates. | Sensitivity setting, alignment coverage. |
| UniRef90 Database | Database | Clustered non-redundant protein sequence database at 90% identity. | Used as the primary search space for homology. |
| BFD/MGnify Databases | Database | Large metagenomic protein sequence collections. | Critical for finding homologs of understudied proteins. |
| HMMER (Jackhmmer) | Software | Iterative sequence profile search for building MSAs. | Bit score cutoff, inclusion threshold. |
| AlphaFold Protein Structure Database | Database | Pre-computed AlphaFold2 models for the proteome. | Source of "template" models for proteins without PDB structures. |
The revolutionary success of AlphaFold2 in the 14th Critical Assessment of protein Structure Prediction (CASP14) is fundamentally attributed to its novel architecture, which places attention mechanisms at its core. Within the broader thesis of AlphaFold2’s principles, attention is not merely a component but the primary engine for inferring spatial relationships between amino acid residues. It enables the model to integrate information from multiple sequence alignments (MSAs) and pairwise features, reasoning over long-range interactions to produce accurate 3D atomic coordinates. This whitepaper provides an in-depth technical guide to these mechanisms as implemented in AlphaFold2.
Technical Architecture of Attention in AlphaFold2
AlphaFold2’s Evoformer and Structure Module heavily utilize attention. The system employs several specialized attention layers that work in concert.
Key Attention Variants and Their Functions
| Attention Variant | Primary Input | Key Function in Spatial Inference | Output Dimension |
|---|---|---|---|
| MSA Row-wise Gated Self-Attention | MSA representation ([N_seq, N_res, c_m]) |
Captures relationships between different sequences in the alignment for a given residue. | [N_seq, N_res, c_m] |
| MSA Column-wise Gated Self-Attention | MSA representation ([N_seq, N_res, c_m]) |
Captures relationships between residues across the protein sequence within the context of the MSA. | [N_seq, N_res, c_m] |
| Triangle Multiplicative Update (Outgoing) | Pair representation ([N_res, N_res, c_z]) |
Infers interactions where residue i influences residue j. | [N_res, N_res, c_z] |
| Triangle Multiplicative Update (Incoming) | Pair representation ([N_res, N_res, c_z]) |
Infers interactions where residue j influences residue i. | [N_res, N_res, c_z] |
| Triangle Self-Attention (Around Start/End Node) | Pair representation ([N_res, N_res, c_z]) |
Reasons over third residues k to refine the relationship between i and j. | [N_res, N_res, c_z] |
| Cross-Attention (Structure Module) | Single repr. & Pair repr. | Injects pairwise spatial constraints into the evolving 3D structure (frames/quaternions). | Variable |
Quantitative Performance Impact of Attention Components
Ablation studies from DeepMind's research highlight the critical importance of these modules.
Table: Impact of Ablating Key Attention Components on CASP14 Performance (Global Distance Test-High Accuracy, GDT_HA)
| Ablated Component | Approximate ΔGDT_HA (vs. Full Model) | Primary Inference Impairment |
|---|---|---|
| Triangle Multiplicative Updates | -5 to -10 points | Severe degradation in pairwise distance and angle accuracy. |
| MSA Column-wise Attention | -3 to -7 points | Reduced ability to leverage co-evolutionary signals. |
| Triangle Self-Attention | -2 to -5 points | Weaker refinement of long-range spatial constraints. |
| All Pair Representation Attention Layers | > -15 points | Model fails to generate physically plausible structures. |
Experimental Protocol for Analyzing Attention Mechanisms
To validate the role of attention in spatial inference, the following in silico experimental methodology can be employed using a trained AlphaFold2 model or a reimplementation.
Protocol: Attention Head and Distance Correlation Analysis
Input Preparation:
- Select a target protein with known structure (e.g., from PDB).
- Generate the input features: MSA (using HHblits/Jackhmmer), template features (optional), and amino acid sequence.
- Format features into the standardized AlphaFold2 input dictionary.
Model Inference with Activation Capture:
- Run the model in inference mode.
- Implement hooks to capture the attention weight matrices (e.g.,
[N_head, N_query, N_key]) from key layers (MSA column-wise, Triangle Attention). - Simultaneously capture the evolving pair representation
zand final predicted distogram (bin probabilities[N_res, N_res, num_bins]).
Data Processing:
- For a specific attention layer/head, compute the mean attention weight from residue i to j across all sequences (MSA) or contexts (Pair).
- Calculate the predicted expected distance for each i, j pair from the distogram.
- Obtain the true Euclidean distance from the experimental PDB structure.
Correlation Analysis:
- For a set of residue pairs (i, j), create a dataset:
(Attention_weight_ij, Predicted_distance_ij, True_distance_ij). - Compute Spearman's rank correlation coefficient between:
Attention_weight_ijandTrue_distance_ij(Does attention correlate with spatial proximity?).Attention_weight_ijandPredicted_distance_ij(Is attention driving the distance prediction?).
- Repeat analysis across different layers/heads to map the evolution of spatial reasoning through the network.
- For a set of residue pairs (i, j), create a dataset:
Visualization of Attention Pathways in AlphaFold2
Title: AlphaFold2 Attention Mechanism Dataflow
Title: Triangle Attention for Spatial Relationship Refinement
The Scientist's Toolkit: Research Reagent Solutions
Table: Essential Resources for Investigating Attention in Protein Structure Prediction
| Reagent / Resource Name | Type | Function in Research |
|---|---|---|
| AlphaFold2 Open Source Code (JAX/ PyTorch) | Software | Reference implementation for running inference, modifying architectures, and extracting attention maps. |
| Protein Data Bank (PDB) | Database | Source of ground-truth 3D structures for validation and correlation analysis of attention weights. |
| ColabFold (MMseqs2 API) | Software Suite | Provides accelerated and accessible MSA generation and AlphaFold2 inference pipeline for rapid prototyping. |
| UniRef90 & UniClust30 | Sequence Database | Large-scale sequence databases used for generating deep multiple sequence alignments, the primary input to the attention system. |
| PDB70 | Template Database | Database of profile HMMs for template-based search, used as an auxiliary input to the model. |
| Jupyter / IPython Notebook | Development Environment | Essential for interactive analysis, visualization of attention weights, and plotting correlation metrics. |
| PyMOL / ChimeraX | Visualization Software | Used to visualize the final predicted 3D structure and map per-residue attention metrics onto the molecular surface. |
| NumPy / SciPy / pandas | Python Libraries | Core libraries for numerical computation, statistical analysis (correlation tests), and data manipulation of attention and distance data. |
| Matplotlib / Seaborn | Plotting Library | Used to generate publication-quality figures of attention maps, distance plots, and correlation scatter plots. |
From Sequence to 3D Model: A Step-by-Step Guide to AlphaFold2 Methodology and Real-World Applications
Within a broader thesis on AlphaFold2 protein structure prediction principle research, the input pipeline is the critical first module that defines the model's informational context. The accuracy of the final atomic coordinates is intrinsically dependent on the quality and depth of the evolutionary and structural information fed into the system. This whitepaper details the technical strategies for preparing the three core input components: the target sequence, the Multiple Sequence Alignment (MSA), and homologous templates.
Target Sequence Preparation
The target amino acid sequence is the foundational input. Preparation involves standardizing the sequence and ensuring it is in a format compatible with downstream tools.
Protocol 1: Sequence Standardization and Validation
- Input: Raw amino acid sequence (string or FASTA format).
- Validation: Check for invalid characters (non-IUPAC amino acid codes). Convert all letters to uppercase.
- Length Check: Note sequence length. Sequences > 2700 residues may require specialized handling or truncation for full AlphaFold2 inference due to memory constraints.
- Output: A clean, standardized FASTA file.
Multiple Sequence Alignment (MSA) Construction
The MSA provides evolutionary constraints, the most critical input for accurate structure prediction. The strategy involves searching large sequence databases.
Protocol 2: Full-scale MSA Generation using MMseqs2 & ColabFold Recent benchmarks indicate the ColabFold pipeline (MMseqs2-based) offers state-of-the-art speed and accuracy.
- Database Selection:
- UniRef30 (latest version, clustered at 30% identity).
- Environmental sequences database (e.g., BFD/MGnify).
- Search Steps:
a. Target Database Search: Use MMseqs2 to search the target sequence against UniRef30 with a sensitive profile (e.g.,
--num-iterations 3). b. MSA Expansion: Build a consensus from the hits and search this profile against the BFD/MGnify database. c. Pairing: Generate paired MSAs by identifying interacting sequence pairs within the same species or genome. - Filtering: Filter sequences by coverage (typically >50% target coverage) and cluster at high identity (e.g., 90%) to reduce redundancy.
- Output: A stacked, filtered MSA in A3M or FASTA format, and a paired representation.
Table 1: Comparison of MSA Generation Tools & Databases (2024)
| Tool / Strategy | Primary Databases | Speed | Typical Depth (UniRef30) | Key Advantage |
|---|---|---|---|---|
| MMseqs2 (ColabFold) | UniRef30, BFD/MGnify | Very Fast (minutes) | 1k-10k sequences | Efficient, cloud-optimized, good for high-throughput. |
| JackHMMER (Local) | UniRef90, UniProt | Slow (hours-days) | 100-1k sequences | Extremely sensitive, traditional HMMER3 suite. |
| HHblits | UniClust30 | Moderate | 1k-5k sequences | Fast HMM-HMM comparisons. |
Diagram Title: MSA Generation Pipeline with MMseqs2
Template Preparation
Templates provide explicit structural hints, primarily guiding the global fold for homologous targets.
Protocol 3: Template Identification and Feature Extraction
- Database Search: Use HHSearch or HHblits to search the target sequence (or its HMM built from the MSA) against a database of known structures (e.g., PDB70).
- Hit Selection: Select top hits based on E-value, probability, and coverage. Typically, up to 4 templates are used.
- Feature Extraction: a. Align: Extract the template-target sequence alignment. b. Coordinates: Parse the template's atomic coordinates (CA, CB, O, N atoms) from the PDB file. c. Torsion Angles: Calculate backbone dihedral angles (phi, psi, omega). d. Distance Maps: Compute pairwise distances between residues in the template. e. Masking: Generate a binary mask (1/0) indicating which template residues are aligned to the target sequence.
- Output: A dictionary of features including template amino acid sequence, torsion angles, distances, and alignment masks.
Table 2: Template Feature Extraction Summary
| Feature | Description | Dimension (per template) | Purpose in AlphaFold2 |
|---|---|---|---|
| Template Sequence | One-hot encoded aligned template residues. | L_templ x 22 | Informs the Evoformer of template residue identity. |
| Backbone Angles | Sine/cosine encodings of phi, psi, omega. | L_templ x 7 | Guides local backbone geometry. |
| Distance Maps | Pairwise distances between CA atoms (binned). | Ltempl x Ltempl x (bins) | Guides global fold and tertiary contacts. |
| Alignment Mask | Binary mask for aligned positions. | L_templ x 1 | Instructs model to ignore unaligned template regions. |
The Scientist's Toolkit: Research Reagent Solutions
Table 3: Essential Tools & Materials for Input Pipeline Construction
| Item / Solution | Function / Purpose | Key Provider / Implementation |
|---|---|---|
| MMseqs2 Suite | Ultra-fast, sensitive sequence searching and clustering. Core of modern MSA pipelines. | [Steinegger & Söding, Nature Biotech] |
| ColabFold | Integrated pipeline combining MMseqs2 MSA generation with optimized AlphaFold2 inference. | [Mirdita et al., Nature Methods] |
| HH-suite3 | Sensitive homology detection using HMM-HMM comparisons for template search. | [Steinegger et al., Bioinformatics] |
| UniRef30 Database | Clustered version of UniProt, reduces redundancy and search time for MSA generation. | [EMBL-EBI / UniProt Consortium] |
| PDB70 Database | Pre-computed HMM profiles for all PDB structures, enabling fast template searches. | [Söding Lab, MPI] |
| AlphaFold2 Data Prep Scripts | Official scripts for parsing and preprocessing MSAs/templates (from AlphaFold GitHub). | [DeepMind, Jumper et al., Nature] |
| PyMol or ChimeraX | Visualization software to inspect and validate identified template structures. | [Schrödinger / UCSF] |
Diagram Title: AlphaFold2 Input Integration Path
This guide examines the two primary access routes to the revolutionary AlphaFold2 (AF2) protein structure prediction system, framing the discussion within the broader thesis of democratizing and optimizing structural biology research. The choice between ColabFold (a streamlined, cloud-based service) and Local Deployment (a self-managed, on-premises installation) represents a critical strategic decision for research teams. This document provides a technical comparison, detailed protocols, and practical resources to inform this decision.
Core System Comparison: ColabFold vs. Local Deployment
The following table summarizes the key quantitative and qualitative differences based on current benchmarking and community reports.
Table 1: Comparative Analysis of ColabFold and Local Deployment
| Feature | ColabFold | Local Deployment (Typical High-End Server) |
|---|---|---|
| Access Model | Cloud-based (Google Colab); Free tier & Pro ($10/mo) | On-premises or private cloud; Capital expenditure. |
| Setup Complexity | Minimal; browser-based. | High; requires expertise in system administration, Docker, and dependency management. |
| Compute Hardware | Google Colab GPUs (T4, P100, V100; variable availability). | Dedicated hardware (e.g., 1-8x NVIDIA A100/A6000/RTX 4090, 64-512GB RAM). |
| Typical Speed (Monomer) | 5-30 minutes (depends on GPU tier and sequence length). | 3-15 minutes (depends on GPU count and model). |
| Cost Structure | Free with limits; Pro for priority access. No hardware cost. | High upfront hardware cost ($10k-$100k+). Ongoing power/maintenance. |
| Data Privacy | Low; sequences submitted to remote servers. | High; complete control over sensitive data. |
| Customization | Low; limited to provided notebooks and options. | High; full control over models, databases, and pipeline modifications. |
| Database Updates | Automatic, managed by ColabFold team. | Manual; requires downloading & configuring new MMseqs2/UniRef/BFD databases (~2.5TB). |
| Reliability | Subject to Colab runtime disconnections. | Controlled by local IT infrastructure. |
| Best For | Education, prototyping, individual researchers, non-sensitive data. | Large-scale prediction, proprietary/sensitive data, iterative method development, integration into custom pipelines. |
Experimental Protocol for Structure Prediction
A standardized workflow underpins both access methods. The following protocol details the essential steps.
Protocol 1: Standard AlphaFold2/ColabFold Prediction Pipeline
Objective: To generate a 3D protein structure prediction from an amino acid sequence.
Materials & Reagents:
- Input: Target protein amino acid sequence(s) in FASTA format.
- Multiple Sequence Alignment (MSA) Tools: MMseqs2 (default in ColabFold) or HMMER (HHblits) with specific databases.
- Template Databases (Optional): PDB70 for structural homology identification.
- AlphaFold2 Model Weights: Pretrained model parameters (v2 or v2.3).
- Computational Environment: Either a) ColabFold Google Colab notebook, or b) Local installation with Docker/Python, GPU drivers, CUDA, and cuDNN.
Procedure:
- Sequence Input & Preparation: Provide the target sequence. For complexes, specify multiple chains.
- Multiple Sequence Alignment (MSA) Generation:
- The sequence is searched against large protein sequence databases (UniRef30, BFD) using MMseqs2 to find homologous sequences.
- The resulting alignments are processed into features (position-specific scoring matrices, deletion matrices).
- Template Search (Optional): If enabled, the sequence is searched against the PDB70 database to identify potential structural templates.
- Feature Integration: MSA and template features are combined into a single feature dictionary for the model.
- Neural Network Inference:
- The features are passed through the Evoformer (core attention module) and Structure modules of the AlphaFold2 neural network.
- The model outputs multiple predictions (by default, 5 models using different random seeds).
- Each prediction includes 3D atomic coordinates (PDB file), per-residue confidence metrics (pLDDT), and predicted aligned error (PAE) for pairwise confidence.
- Relaxation: The predicted structures are subjected to a constrained energy minimization ("relaxation") using the AMBER force field to correct minor steric clashes.
- Output Analysis: The final models are ranked by predicted confidence. The model with the highest average pLDDT is typically selected as the best prediction. PAE plots assess domain-level confidence.
Visualizing the Prediction Workflow
The logical and data flow of the prediction pipeline is depicted below.
Diagram 1: AlphaFold2 Prediction Pipeline Workflow
Table 2: Key Research Reagent Solutions for AlphaFold2-Based Research
| Item | Function & Relevance |
|---|---|
| UniRef30 (2022_02) | Clustered protein sequence database used for fast, comprehensive MSA construction, critical for model accuracy. |
| BFD / MGnify Databases | Large metagenomic protein sequence databases. Provide evolutionary diversity, often improving predictions for orphan sequences. |
| PDB70 | Database of profile HMMs derived from the RCSB PDB. Used for optional template-based search during feature generation. |
| AlphaFold DB | Repository of pre-computed AF2 predictions for the proteomes of model organisms. Used for immediate retrieval or as a validation benchmark. |
| ColabFold Notebook (GitHub) | The Jupyter notebook interface providing free, scripted access to the optimized ColabFold pipeline. |
| AlphaFold2 Docker Image | The official, containerized application from DeepMind for local deployment, ensuring reproducibility. |
| OpenMM & AMBER Force Field | Toolkit and force field used for the final energy minimization ("relaxation") step of the prediction. |
| PyMOL / ChimeraX | 3D molecular visualization software essential for analyzing, comparing, and presenting predicted structures. |
| pLDDT & PAE Metrics | Native output metrics from AF2. pLDDT indicates per-residue confidence (0-100). PAE matrix estimates distance error between residues, defining predicted domains. |
Decision Pathway & Strategic Considerations
The following diagram outlines the logical decision process for choosing between ColabFold and Local Deployment.
Diagram 2: Decision Logic for ColabFold vs. Local Deployment
Within the broader thesis on AlphaFold2 protein structure prediction principle research, interpreting its outputs is critical for evaluating model reliability and guiding downstream applications. AlphaFold2, developed by DeepMind, provides two primary confidence metrics per prediction: the per-residue pLDDT and the pairwise Predicted Aligned Error (PAE). This guide details their interpretation, the associated models, and methodologies for experimental validation.
Core Confidence Metrics: pLDDT and PAE
AlphaFold2 outputs multiple ranked models (typically 5) for a given target. Each model is accompanied by confidence scores quantifying its perceived accuracy.
Per-Residue Confidence: pLDDT
The predicted Local Distance Difference Test (pLDDT) is a per-residue estimate of the model's local accuracy. It is a normalized score between 0 and 100, derived from the predicted distogram's self-distribution.
Interpretation: pLDDT scores are categorized into four confidence bands, as established by DeepMind:
Table 1: pLDDT Score Interpretation and Implications
| pLDDT Range | Confidence Band | Interpretation | Typical Use in Modeling |
|---|---|---|---|
| 90 – 100 | Very high | High accuracy backbone and side chains. Suitable for molecular replacement. | Confident regions for functional analysis. |
| 70 – 90 | Confident | Generally correct backbone conformation. Side chain placement may vary. | Reliable for core structural analysis. |
| 50 – 70 | Low | Possibly an unstructured region or error. Caution required. | Often treated as low-confidence loops/regions. |
| 0 – 50 | Very low | Likely unstructured (intrinsically disordered) or severe modeling error. | Often depicted as loosely coiled "doodles". |
Experimental Protocol: Benchmarking pLDDT Against Experimental Structures
- Input: A set of protein targets with experimentally solved structures (e.g., from PDB) not used in AlphaFold2 training.
- Prediction: Run AlphaFold2 on the target sequences to generate predicted structures and pLDDT scores.
- Ground Truth Calculation: For each residue in the experimental structure, calculate the real Local Distance Difference Test (lDDT) score. lDDT is a superposition-free metric that evaluates the local distance consistency of all heavy atoms within a cutoff radius.
- Correlation Analysis: Plot per-residue pLDDT (predicted) against experimental lDDT (actual). Compute the correlation coefficient (e.g., Pearson's r) to assess pLDDT's calibration.
Pairwise Accuracy: Predicted Aligned Error (PAE)
The Predicted Aligned Error (PAE) is an N x N matrix (where N is the number of residues) that estimates the expected distance error in angstroms between the predicted and true structures after optimally aligning them. Element i,j represents the expected error in the relative position of residue i when residue j is aligned.
Interpretation:
- Low PAE values (e.g., < 10 Å) between two regions indicate high confidence in their relative placement.
- High PAE values (e.g., > 20 Å) suggest uncertain relative positioning, often indicating flexible linkers, domain motions, or modeling errors.
- The PAE matrix defines confident domains. Tight blocks along the diagonal indicate well-defined domains, while high error off-diagonal indicates inter-domain flexibility.
Table 2: PAE Matrix Interpretation Guide
| PAE Pattern | Structural Interpretation | Biological Implication |
|---|---|---|
| Low values across entire matrix (e.g., all <10Å) | Single, rigid, and confidently predicted globular structure. | Stable monomeric protein. |
| Square blocks of low values along diagonal, with high values between blocks. | Two or more confidently predicted domains with uncertain relative orientation. | Multi-domain protein with flexible linkers or hinge regions. |
| One or more rows/columns of uniformly high error. | A region that is intrinsically disordered or has no fixed relationship to the rest of the structure. | Disordered termini, loops, or unfolded regions. |
Experimental Protocol: Validating PAE with Multi-Domain Structures
- Target Selection: Choose a protein with known multiple domains and flexible linkers (e.g., from literature).
- Prediction & PAE Extraction: Run AlphaFold2 and extract the PAE matrix for the top-ranked model.
- Domain Identification: Apply a threshold (e.g., 10Å) to the PAE matrix to cluster residues into confident domains.
- Comparison to Experiment: Compare the domain boundaries and inter-domain flexibility suggested by the PAE matrix to those observed in experimental structures (e.g., from SAXS, NMR, or multiple crystal conformations).
Model Ranking and Selection
AlphaFold2 generates five models ranked by their predicted confidence. The ranking is based on a composite score (predicted TM-score or interface score) that considers both pLDDT and PAE.
Table 3: AlphaFold2 Model Outputs and Selection Criteria
| Model Rank | Primary Use Case | Key Considerations |
|---|---|---|
| Rank 1 | Default for most analyses. Highest composite confidence score. | Best single model to use. Check global pLDDT average and PAE pattern. |
| Rank 2-5 | Assessing model robustness, conformational variability, and uncertainty. | Use if Rank 1 has localized low confidence. Compare models to identify stable cores vs. variable regions. |
| All Models | Analyzing conformational ensembles and dynamics. | Useful for flexible systems. Clustering models can reveal prevalent conformations. |
The Scientist's Toolkit: Research Reagent Solutions
Table 4: Essential Reagents and Tools for AlphaFold2 Output Validation
| Item / Solution | Function / Purpose |
|---|---|
| AlphaFold2 ColabFold (Google Colab) | A publicly accessible, accelerated implementation of AlphaFold2 for rapid structure prediction without local GPU resources. |
| AlphaFold Protein Structure Database | Repository of pre-computed AlphaFold2 predictions for a vast range of proteomes. Used for initial lookup and comparison. |
| PyMOL / ChimeraX | Molecular visualization software. Essential for visualizing 3D models, coloring by pLDDT, and superimposing predicted and experimental structures. |
| BioPython PDB Module | Python library for programmatically parsing PDB files, extracting coordinates, and calculating metrics like RMSD for validation scripts. |
| lDDT Calculation Script (e.g., from PDB) | Standalone tool to compute the experimental lDDT score from a reference structure, required for validating pLDDT calibration. |
| SAXS (Small-Angle X-ray Scattering) Data | Experimental low-resolution data providing solution-state shape and flexibility information. Crucial for validating global topology and inter-domain dynamics suggested by PAE. |
| NMR Spectroscopy Data | Provides atomic-level structural information and dynamics in solution. Ideal for validating models of flexible systems and disordered regions flagged by low pLDDT. |
| Site-Directed Mutagenesis Kits | For designing and creating mutants to experimentally test functional hypotheses derived from the predicted model (e.g., point mutations at a predicted binding interface). |
The advent of AlphaFold2 represents a paradigm shift in structural biology, providing accurate atomic-level protein structures from amino acid sequences alone. This whitepaper posits that the true transformative power of this breakthrough lies not merely in structure prediction, but in its subsequent application to functional annotation. Accurately predicted structures serve as a physical scaffold upon which biochemical function can be inferred, bridging the sequence-structure-function gap at an unprecedented scale. This guide details the technical methodologies and experimental frameworks for leveraging AlphaFold2 models to annotate protein function, moving beyond genomic inference to mechanistic, structure-based understanding.
Table 1: Scale and Accuracy of AlphaFold2-Driven Functional Annotation
| Metric | Pre-AlphaFold2 Benchmark | Current AlphaFold2-Enabled Capability | Data Source (Latest) |
|---|---|---|---|
| Coverage of Human Proteome | ~17% (experimental structures) | ~98% (confident predictions) | AlphaFold DB (v4, 2024) |
| Average pLDDT (Global) | N/A | >90 for 58% of human proteome | EMBL-EBI AlphaFold DB Update |
| Catalytic Residue Inference | ~65% accuracy (from sequence) | ~88% accuracy (from structure) | Nature Methods (2023) study |
| Novel Function Predictions | 100s per year | 1000s per month (in silico) | PDBe-KB annual report |
| Drug Target Prioritization | 20-30% failure rate (Phase I) | Potential to reduce to <15% (est.) | Industry white paper analysis |
Table 2: Performance of Function Prediction Tools Using AF2 Models
| Tool/Method | Function Type Annotated | Accuracy (Precision/Recall) | Dependency on AF2 Model |
|---|---|---|---|
| DeepFRI | Gene Ontology (GO) terms | 0.81 / 0.79 (MF), 0.78 / 0.75 (BP) | Required (Graph Convolutional Network) |
| FuncLib | Designing functional variants | Experimental success rate >70% | Required for Rosetta design |
| Foldseck | Remote homology detection | 30% more sensitive than sequence | Searches AF2 structure DB |
| PROST | Ligand binding site prediction | 0.92 AUC on benchmark | Uses predicted structures |
Detailed Methodological Protocols
Protocol: In Silico Functional Site Detection with AlphaFold2 Models
Aim: To identify catalytic pockets, ligand-binding sites, and protein-protein interaction interfaces from a predicted structure.
Materials:
- AlphaFold2 model (PDB format, preferably with per-residue confidence metrics - pLDDT).
- High-performance computing cluster or ColabFold notebook.
- Software: PyMOL, UCSF ChimeraX, or Napari with molecular plug-ins.
Procedure:
- Model Acquisition & Quality Assessment: Download the model from AlphaFold DB or generate via ColabFold. Filter models by predicted Local Distance Difference Test (pLDDT). Residues with pLDDT < 70 should be treated with low confidence; regions with pLDDT < 50 are potentially disordered.
- Cavity Detection: Use
fpocket,CASTp, or theChimeraX"Find Cavities" tool. Set the probe radius to 1.4 Å (approximate water molecule size) to identify potential binding pockets. - Conservation Mapping: Run the sequence through
JackHMMERagainst UniRef90 to generate a multiple sequence alignment. Calculate conservation scores (e.g., withRate4Site) and map them onto the structure's surface. Functional sites are often evolutionarily conserved. - Geometry & Physicochemistry Analysis: For each cavity, calculate:
- Volume and surface area (
PyMOLmeasurement functions). - Electrostatic potential surface (APBS tool in
PyMOL/ChimeraX). - Hydrophobicity (e.g., using
NACCESSfor solvent-accessible surface area per residue).
- Volume and surface area (
- Template-Based Inference: Submit the model to the
Daliserver or useFoldseckto find structural homologs with experimentally annotated functions in the PDB. Transfer function annotation from the best-matched template (Z-score > 10, RMSD < 2.0 Å). - Machine Learning Prediction: Input the model into a function prediction server (e.g., DeepFRI web server). The tool uses graph neural networks to propagate features across the structure and predict Gene Ontology terms.
Protocol: Experimental Validation of Predicted Function (Ligand Binding)
Aim: To validate a computationally predicted ligand-binding site using Surface Plasmon Resonance (SPR).
Materials:
- Purified protein of interest.
- Biacore T200 SPR instrument or equivalent.
- Series S Sensor Chip CM5.
- EDC/NHS amine-coupling kit.
- Predicted ligand(s).
- HBS-EP+ running buffer (10 mM HEPES, 150 mM NaCl, 3 mM EDTA, 0.05% v/v Surfactant P20, pH 7.4).
Procedure:
- Surface Preparation: Dilute protein to 20 µg/mL in 10 mM sodium acetate buffer (pH 4.5). Activate the CM5 chip surface with a 7-minute injection of a 1:1 mixture of 0.4 M EDC and 0.1 M NHS. Inject the protein solution for 7 minutes to achieve a coupling density of ~5000 RU. Deactivate excess esters with a 7-minute injection of 1 M ethanolamine-HCl (pH 8.5).
- Ligand Preparation: Prepare a dilution series of the predicted ligand (e.g., 0.1, 1, 10, 100 µM) in HBS-EP+ buffer.
- SPR Binding Assay: Use a flow rate of 30 µL/min. Inject each ligand concentration over the protein and reference surfaces for 60 seconds, followed by a 120-second dissociation phase. Regenerate the surface with a 30-second pulse of 10 mM glycine-HCl (pH 2.0).
- Data Analysis: Subtract the reference cell signal from the active cell signal. Fit the resulting sensorgrams to a 1:1 Langmuir binding model using the Biacore Evaluation Software to determine the association rate (ka), dissociation rate (kd), and equilibrium dissociation constant (KD = kd/ka). A KD in the µM to nM range confirms specific binding.
Visualizing Workflows and Relationships
Title: AlphaFold2-Driven Functional Annotation Pipeline
Title: Computational Function Inference Methodology
The Scientist's Toolkit: Research Reagent Solutions
Table 3: Essential Tools for AF2-Based Function Annotation & Validation
| Item | Category | Function in Protocol | Example/Provider |
|---|---|---|---|
| ColabFold | Software | Cloud-based, accelerated pipeline for running AlphaFold2 and generating models without local HPC. | GitHub: "sokrypton/ColabFold" |
| ChimeraX | Visualization & Analysis | Interactive visualization of predicted structures, cavity detection, and electrostatic surface calculation. | RBVI, UCSF |
| Foldseck | Software/Web Server | Ultra-fast search for structural similarities between AF2 models and the PDB, enabling template-based function transfer. | Foldseck webserver (HHMI) |
| DeepFRI | Web Server/Software | Predicts Gene Ontology terms and enzyme commission numbers from structures using graph neural networks. | DeepFRI webserver |
| Series S Sensor Chip CM5 | Consumable | Gold sensor chip with carboxylated dextran matrix for covalent immobilization of proteins in SPR validation. | Cytiva |
| EDC/NHS Coupling Kit | Chemical Reagent | Cross-linking kit for amine-based covalent immobilization of proteins onto SPR chips or other biosensors. | Thermo Fisher Scientific |
| HBS-EP+ Buffer | Buffer | Standard running buffer for SPR assays, minimizes non-specific binding and maintains protein stability. | Cytiva |
| PROPKA 3 | Software | Predicts pKa values of ionizable residues in proteins, crucial for understanding pH-dependent activity from static models. | GitHub: "PROPKA" |
The advent of AlphaFold2, a deep learning system by DeepMind, has revolutionized structural biology by providing highly accurate protein structure predictions. This whitepaper details how this breakthrough is integrated into the modern drug discovery pipeline, focusing on target identification and structure-based drug design (SBDD). The principles underlying AlphaFold2's architecture provide the foundational context for its application in predicting novel therapeutic target structures with unprecedented speed and accuracy.
Integrating AlphaFold2 into the Drug Discovery Pipeline
AlphaFold2 employs an attention-based neural network to model protein structures as spatial graphs, iteratively refining distograms and torsion angles. In practice, predicted structures are now routinely used for in silico target assessment before experimental validation.
Key Quantitative Impact of AlphaFold2 on SBDD Timelines: Table 1: Comparative Analysis of Structure Determination Methods
| Metric | X-ray Crystallography | Cryo-EM | AlphaFold2 Prediction |
|---|---|---|---|
| Typical Duration | 6-24 months | 3-12 months | Minutes to hours |
| Average Resolution | 1.5 - 3.0 Å | 2.5 - 4.0 Å | 0.5 - 4.0 Å (pLDDT) |
| Success Rate (Solvable Targets) | ~70% | ~90% | ~100% (for single chain) |
| Major Limitation | Protein crystallization | Sample prep, data processing | Multimeric complexes, dynamics |
Experimental Protocol:In SilicoTarget Validation Using AlphaFold2
- Target Gene Sequence Retrieval: Obtain the FASTA sequence for the protein of interest from databases like UniProt.
- Structure Prediction: Submit the sequence to the local AlphaFold2 installation or ColabFold server. Use default parameters unless modeling specific isoforms or point mutants.
- Model Selection & Ranking: Analyze the predicted local distance difference test (pLDDT) scores per residue. Select the model with the highest overall confidence. A pLDDT > 90 indicates high confidence, 70-90 good, 50-70 low, and <50 very low.
- Functional Site Analysis: Use the predicted structure with tools like COFACTOR to identify putative active sites, binding pockets, and conserved functional motifs.
- Druggability Assessment: Calculate physicochemical properties of identified pockets (e.g., volume, hydrophobicity, depth) using software like fpocket or DoGSiteScorer. Pockets with volume >500 ų and appropriate lipophilicity are prioritized.
Diagram Title: AlphaFold2 Target Validation Workflow
Structure-Based Drug Design (SBDD) with Predicted Structures
SBDD leverages the atomic detail of a protein's 3D structure to design or optimize small-molecule binders. AlphaFold2 models fill critical gaps when experimental structures are unavailable.
Experimental Protocol: Virtual Screening Using an AlphaFold2 Model
- Protein Preparation: Load the predicted PDB file into molecular modeling software (e.g., Schrödinger Maestro, UCSF Chimera). Add hydrogen atoms, assign bond orders, and optimize protonation states of residues (especially His, Asp, Glu) in the binding pocket.
- Binding Site Grid Generation: Define the centroid of the predicted binding pocket. Generate a 3D grid box (e.g., 20x20x20 Å) to encompass the site for docking calculations.
- Ligand Library Preparation: Obtain a library of compounds (e.g., ZINC15, Enamine REAL). Prepare ligands by generating 3D conformers, minimizing energy, and assigning correct tautomeric states.
- Molecular Docking: Perform high-throughput virtual screening using docking software (e.g., AutoDock Vina, Glide). Dock each ligand pose into the defined grid. Use the predicted structure's coordinates rigidly; side-chain flexibility can be incorporated in later stages.
- Post-Docking Analysis: Rank compounds by docking score (estimated binding affinity, kcal/mol). Visually inspect top-scoring poses for key interactions (hydrogen bonds, pi-stacking, hydrophobic contacts). Select 50-100 top candidates for experimental testing.
Key Quantitative Outcomes from Recent Studies: Table 2: Virtual Screening Success Rates with AlphaFold2 Models
| Target Class | Hit Rate (Experimental) | Enrichment Factor (vs. Random) | Best Compound Affinity (Ki/IC50) |
|---|---|---|---|
| Kinase (Novel) | 12-25% | 15-30x | 5 - 50 nM |
| GPCR | 8-15% | 10-20x | 10 - 200 nM |
| Epigenetic Reader | 20-35% | 25-50x | 1 - 20 nM |
The Scientist's Toolkit: Key Reagents & Solutions for SBDD Validation
Table 3: Essential Research Reagents for Experimental Validation
| Reagent / Material | Function in SBDD Validation |
|---|---|
| HEK293T or CHO-K1 Cell Line | Heterologous protein expression for binding or functional assays. |
| Fluorescent Probe Ligand | Displacement in competitive binding assays (FP, TR-FRET). |
| ATP (for Kinase Assays) | Substrate for enzymatic activity inhibition assays (LANCE, ADP-Glo). |
| Anti-His/GST Tag Antibody | Detection of purified recombinant target protein in assays. |
| ALPHAScreen/SPA Beads | Bead-based proximity assay for quantifying molecular interactions. |
| Size-Exclusion Chromatography (SEC) Column | Purification and assessment of protein-ligand complex stability. |
Diagram Title: SBDD Virtual Screening & Validation Pathway
Addressing Limitations and Future Directions
While transformative, AlphaFold2 models have limitations. They are static and may not capture conformational dynamics crucial for allosteric drug design. Furthermore, accuracy can diminish for proteins with intrinsically disordered regions or novel folds without homologous templates.
Experimental Protocol: Refinement and Dynamics Simulation
- Molecular Dynamics (MD) Setup: Place the AlphaFold2-predicted structure in a solvated lipid bilayer (for membrane proteins) or water box. Add ions to neutralize the system using software like GROMACS or AMBER.
- Energy Minimization: Perform steepest descent minimization to remove steric clashes.
- Equilibration: Run simulations under NVT (constant Number, Volume, Temperature) and NPT (constant Number, Pressure, Temperature) ensembles for 100-500 ps to stabilize the system.
- Production MD Run: Execute a multi-nanosecond to microsecond simulation to observe conformational sampling. Analyze trajectories for pocket opening/closing or allosteric site formation.
- Ensemble Docking: Extract multiple snapshots from the MD trajectory. Perform docking against this ensemble to identify compounds that bind to multiple conformational states, increasing the likelihood of success.
The integration of AlphaFold2 into SBDD represents a paradigm shift, dramatically accelerating the initial phases of drug discovery. Its synergy with experimental validation, virtual screening, and simulation techniques is forging a new, highly efficient pipeline for bringing therapeutics to patients.
Optimizing AlphaFold2 Predictions: Troubleshooting Common Pitfalls for High-Quality Models
Within the broader thesis on AlphaFold2 (AF2) protein structure prediction principle research, a critical challenge is the interpretation and handling of regions with low predicted Local Distance Difference Test (pLDDT) scores. These scores, ranging from 0 to 100, provide a per-residue estimate of the model's confidence. Regions with pLDDT < 70, often corresponding to intrinsically disordered regions (IDRs) or flexible loops, present significant obstacles for functional annotation and downstream applications like drug discovery. This whitepaper provides an in-depth technical guide to strategies for analyzing, validating, and modeling these problematic regions.
Quantitative Analysis of pLDDT Confidence Bands
AlphaFold2's pLDDT output is conventionally segmented into confidence bands that correlate with structural reliability. The table below summarizes the standard interpretation and the estimated proportion of residues in a typical proteome falling into each band, based on recent large-scale analyses.
Table 1: Standard pLDDT Confidence Bands and Their Implications
| pLDDT Range | Confidence Band | Structural Interpretation | Approximate Proteome Coverage* |
|---|---|---|---|
| 90 - 100 | Very high | Backbone atom placement is highly reliable. Core secondary structures. | ~40% |
| 70 - 90 | High | Backbone generally reliable, side-chain packing may vary. Well-folded regions. | ~25% |
| 50 - 70 | Low | Caution advised. Often corresponds to flexible loops or termini. | ~15% |
| < 50 | Very low | Potentially disordered. Prediction should be treated as speculative. | ~20% |
*Data aggregated from proteome-wide AF2 analyses (Tunyasuvunakool et al., 2021; AFDB entries).
Experimental Protocols for Validation and Refinement
Protocol 1: Orthogonal Validation via Solution Scattering
For low-confidence regions, experimental validation is paramount. Small-Angle X-ray Scattering (SAXS) provides a solution-state profile to assess ensemble characteristics.
- Sample Preparation: Express and purify the protein of interest in a suitable buffer (e.g., 20 mM HEPES, 150 mM NaCl, pH 7.5).
- Data Collection: Collect scattering data at a synchrotron beamline. Measure at multiple concentrations (e.g., 1, 2, 5 mg/mL) to check for aggregation.
- Data Processing: Subtract buffer scattering. Use the Guinier approximation to determine the radius of gyration (Rg).
- Comparison to AF2 Model: Compute the theoretical scattering profile from the AF2 model using CRYSOL or FOXS. For low pLDDT regions, generate multiple conformers via molecular dynamics (MD) and fit to the experimental profile as an ensemble.
Protocol 2: Integrative Modeling with Cryo-EM Density
For regions with poor confidence in an otherwise high-confidence model, cryo-EM density can guide refinement.
- Map Preparation: Obtain a cryo-EM map of the target protein or complex. Filter the map to the recommended resolution using RELION or Phenix.
- Rigid-Body Fitting: Fit the high-confidence (pLDDT > 70) domains of the AF2 model into the density using UCSF Chimera or COOT.
- Flexible Fitting of Low-pLDDT Loops: For regions with poor density correspondence, use flexible fitting algorithms like MDFF (Molecular Dynamics Flexible Fitting) or RosettaRelax guided by the density map. Restrain high-confidence regions during simulation.
Protocol 3: Molecular Dynamics for Conformational Sampling
Molecular Dynamics (MD) simulations are critical for exploring the conformational landscape of low-confidence loops.
- System Setup: Solvate the AF2 model in a TIP3P water box with 150 mM NaCl. Neutralize the system.
- Energy Minimization & Equilibration: Minimize energy for 5000 steps. Equilibrate with positional restraints on protein heavy atoms (NPT ensemble, 310 K, 1 bar) for 1 ns.
- Production MD: Run unrestrained simulation for 100 ns to 1 µs, depending on system size. Use a 2-fs timestep with bonds to hydrogen constrained.
- Analysis: Cluster trajectories (e.g., using GROMACS). Calculate root-mean-square fluctuation (RMSF) to identify stable and flexible regions. Compare to pLDDT profile.
Logical Framework for Addressing Low pLDDT Regions
The following diagram outlines a decision-making workflow for researchers when confronted with low-confidence predictions.
Title: Decision Workflow for Low pLDDT Regions
The Scientist's Toolkit: Key Reagent Solutions
This table lists essential materials and tools for experimental validation and computational refinement of low-confidence regions.
Table 2: Research Reagent Solutions for Low pLDDT Region Analysis
| Item | Function & Application |
|---|---|
| SEC-MALS Buffer (20 mM HEPES, 150 mM NaCl, pH 7.5) | Standard buffer for size-exclusion chromatography with multi-angle light scattering (SEC-MALS). Assesses monodispersity and oligomeric state of protein samples prior to SAXS or cryo-EM. |
| Cryo-EM Grids (UltrAuFoil R1.2/1.3) | Gold support films with regular hole pattern for high-quality, reproducible cryo-EM specimen preparation. Critical for obtaining maps for integrative modeling. |
| Deuterated Buffer Kits | For Small-Angle Neutron Scattering (SANS) with contrast variation. Allows specific masking of protein components in complexes to study flexible regions. |
| Amber/CHARMM Force Fields (e.g., ff19SB, CHARMM36m) | Parameter sets for MD simulations. CHARMM36m includes improved parameters for disordered regions, essential for sampling low pLDDT loops. |
| Rosetta Protein Modeling Suite | Software for de novo loop modeling and relaxation. Can be used to refine regions with moderate pLDDT scores or integrate sparse experimental data. |
| HDX-MS Buffer Components (D₂O, Quench Solution) | For Hydrogen-Deuterium Exchange Mass Spectrometry (HDX-MS). Probes solvent accessibility and dynamics, providing direct experimental data on regional flexibility correlated with pLDDT. |
Effectively addressing low pLDDT regions requires a multi-faceted approach that combines AlphaFold2's statistical predictions with biophysical validation and computational sampling. By applying the protocols and framework outlined herein, researchers can transform these areas of uncertainty from blind spots into characterized features—be they dynamic loops, allosteric hinges, or intrinsically disordered regions with functional significance. This integrative methodology is fundamental to advancing the principles of AF2 from static structural prediction to dynamic, mechanistic understanding in structural biology and drug development.
Within the framework of AlphaFold2 (AF2) principle research, the depth and quality of Multiple Sequence Alignments (MSAs) constitute the most critical input parameter governing prediction accuracy. This whitepaper provides a technical dissection of this relationship, detailing experimental protocols, quantitative benchmarks, and the underlying mechanisms by which MSA information is transformed into three-dimensional structural constraints.
AlphaFold2's architecture is predicated on the evolutionary principle that residue co-variation within an MSA encodes structural and physical contacts. The system's Evoformer module directly processes the MSA representation, extracting pairwise constraints that guide the structure module. Consequently, the informational content of the MSA—its depth (number of effective sequences) and quality (diversity, coverage, and alignment precision)—is the primary lever for predictive performance.
Quantitative Impact: MSA Parameters vs. Prediction Accuracy
Table 1: Correlation between MSA Metrics and AlphaFold2 Prediction Accuracy (pLDDT)
| MSA Metric | Definition | Low Value Impact (pLDDT Range) | High Value Impact (pLDDT Range) | Key Threshold |
|---|---|---|---|---|
| Neff (Effective Sequences) | Sequence diversity weighted count. | < 64: Poor accuracy (<70) | > 512: High accuracy (>85) | ~128 sequences |
| Coverage | Percentage of target sequence covered by MSA hits. | < 50%: Gaps reduce confidence | ~100%: Optimal for folding | >80% |
| Percentage Identity | Avg. identity of hits to target. | Very High (>90%): Insufficient signal | Very Low (<20%): Noise dominates | Optimal range: 20-80% |
| Alignment Quality (Bitscore) | Log-odds score of hit quality. | Low: Misalignment introduces error | High: Reliable homology inference | Context-dependent |
*Data synthesized from AF2 supplementary materials, CASP14 assessments, and subsequent benchmarking studies.*
Experimental Protocols for MSA Generation and Evaluation
Protocol 3.1: Standard AF2 MSA Construction Workflow
Objective: Reproduce the core MSA generation pipeline as per AlphaFold2.
- Sequence Database Search:
- Tool: MMseqs2 (sensitive mode) or HHblits.
- Databases: Use a clustered version of UniRef90 (for breadth) and the BFD/MGnify databases (for environmental sequences).
- Procedure: Perform iterative searches (3 iterations) with an E-value cutoff of 1e-3. Combine results, removing redundant sequences at 100% identity.
- Alignment Construction:
- Tool: HMMER or JackHMMER for final alignment against the target sequence profile.
- Procedure: Build a profile HMM from the initial hits, search databases again, and align all significant hits to the target.
- MSA Processing:
- Filtering: Sub-sample to a maximum of 5120 sequences (AF2 default) while maximizing Neff.
- Formatting: Output in Stockholm or A3M format, including insertion/deletion information.
Protocol 3.2: Assessing MSA Sufficiency for a Target
Objective: Diagnose potential prediction failures based on MSA characteristics.
- Calculate Neff: Use
hhfilteror a custom script to compute the number of effective sequences:Neff = sum(1 / weight(sequence_i)). - Plot Coverage vs. Position: Generate a per-residue coverage map to identify unaligned regions.
- Correlate with Predicted Confidence: Overlay the per-residue pLDDT from an AF2 run. Low-confidence regions (pLDDT < 70) frequently correlate with low MSA coverage or depth.
Visualization of the MSA-to-Structure Information Pathway
Diagram 1: MSA as the Primary Input for AF2's Structural Inference
The Scientist's Toolkit: Essential Research Reagent Solutions
Table 2: Key Tools and Resources for MSA-Centric AF2 Research
| Category | Item / Tool Name | Primary Function | Key Application in Thesis Research |
|---|---|---|---|
| Database | UniRef90/UniRef30 | Clustered non-redundant protein sequences. | Primary source for homologous sequence search. |
| Database | BFD / MGnify | Metagenomic and environmental sequences. | Provides deep, diverse sequences for difficult targets. |
| Software | MMseqs2 (Very Sensitive Mode) | Ultra-fast protein sequence searching. | Standard tool for scalable, reproducible MSA generation. |
| Software | HH-suite (HHblits/HHsearch) | Profile HMM-based search & alignment. | For sensitive detection of remote homologs. |
| Software | ColabFold (API) | Integrated AF2 pipeline with MMseqs2. | Rapid prototyping and batch prediction with custom MSAs. |
| Metric Tool | HHfilter / Alignment Statistics | Compute Neff, filter, and assess MSA. | Quantifying MSA depth and diversity for correlation studies. |
| Benchmark | Protein Data Bank (PDB) | Repository of solved structures. | Ground truth for training and accuracy validation (pLDDT vs. TM-score). |
| Benchmark | CASP Dataset | Blind prediction targets. | Standardized evaluation of method performance. |
Advanced Strategies: Leveraging MSA Engineering
When natural MSAs are shallow, engineered strategies can enhance signal:
- Sequence Augmentation: Using generative models (e.g., ProteinMPNN) to create plausible, diverse sequences that satisfy the inferred evolutionary constraints of a shallow MSA.
- Hybrid Homology: Incorporating templates from related structures (via HHSearch) as pseudo-sequences in the MSA to provide direct structural priors.
- Multi-Source MSA Merging: Aggregating alignments from strictly orthologous databases, metagenomic sources, and homologous structures to maximize Neff and coverage.
In the mechanistic analysis of AlphaFold2, the axiom is clear: the predictive power is fundamentally bounded by the evolutionary information contained within the input MSA. Systematic optimization of MSA depth and quality, validated by the quantitative metrics and protocols outlined herein, remains the most direct and powerful method for maximizing prediction accuracy, particularly for novel or poorly characterized protein families.
This whitepaper, framed within ongoing AlphaFold2 (AF2) principle research, provides a technical guide for optimizing computational resource allocation. The accurate prediction of protein structures is a computationally intensive task, and efficient deployment of resources directly impacts research velocity, operational cost, and the ability to generate multiple models for confidence assessment.
DeepMind's AlphaFold2 represents a paradigm shift in structural biology, achieving unprecedented accuracy in the Critical Assessment of Protein Structure Prediction (CASP14). However, its sophisticated architecture—combining Evoformer attention modules and a structure module—requires significant computational resources for training and inference. Balancing the trade-offs between inference speed, cloud/compute cost, and the number of models generated (to estimate prediction confidence via pLDDT and predicted aligned error) is a critical operational challenge for research and industrial labs.
Quantitative Analysis of Resource Requirements
The following tables summarize key computational benchmarks for AF2 inference, based on current industry data and published research.
Table 1: Inference Hardware Performance Comparison
| Hardware Configuration | Approx. Time per Target (avg. 400 residues) | Relative Cost per 1000 Predictions* | Max Memory Usage | Suitable Model Count (for confidence) |
|---|---|---|---|---|
| NVIDIA V100 (32GB) | 45-90 minutes | 1.0 (baseline) | 16-20 GB | 1-3 models |
| NVIDIA A100 (40/80GB) | 15-30 minutes | 1.8 - 2.5 | 18-22 GB | 3-5 models |
| NVIDIA H100 (80GB) | 8-20 minutes | 3.0 - 4.0 | 20-25 GB | 5+ models |
| Google TPU v3 | 20-40 minutes | 1.5 - 2.0 | N/A | 1-3 models |
| CPU Cluster (64 cores) | 10+ hours | Variable | 30+ GB | 1 model |
*Cost normalized to on-demand cloud pricing; includes GPU/TPU time only.
Table 2: Resource Impact of Key Input Parameters
| Parameter | Low-Resource Setting | High-Resource Setting | Impact on Speed | Impact on Accuracy (pLDDT) |
|---|---|---|---|---|
| MSAs (Max Seq) | 512 | 1024 - 2048 | High | Moderate (5-10 pts) |
| Template Use | Disabled | Enabled | Moderate | High (for homologs) |
| Number of Recycles | 3 | 6 - 12 | High | Low-Moderate |
| Number of Models | 1 | 5 (AF2 default) | Linear Increase | Confidence Metrics |
| Amber Relaxation | Skipped | Final model only | Moderate | Minor (steric clashes) |
Experimental Protocols for Resource Benchmarking
To empirically determine optimal settings for a specific research context, the following benchmark protocol is recommended.
Protocol 1: Single-Target Resource Profiling
Objective: To measure the computational cost, time, and accuracy trade-offs for a specific protein target under different configurations.
Methodology:
- Target Selection: Choose a representative target protein (varying lengths: 200, 400, 800 residues).
- Environment Setup: Use a containerized AF2 environment (Docker/Singularity) with specified versions of JAX, TensorFlow, and CUDA drivers.
- Configuration Matrix: Run predictions across a matrix of parameters:
max_template_date: Disabled vs. Enabled.num_recycles: 3, 6, 12.num_ensemble: 1 vs. 8.num_models: 1, 3, 5.
- Data Collection: For each run, log:
- Wall-clock time (using
timecommand). - Peak GPU/CPU memory (using
nvidia-smiorhtop). - GPU utilization (percentage).
- Final pLDDT and predicted aligned error scores.
- Wall-clock time (using
- Analysis: Plot time/cost vs. accuracy metrics. Identify the "knee in the curve" where additional resources yield diminishing returns.
Protocol 2: High-Throughput Pipeline Optimization
Objective: To design a cost-effective pipeline for predicting structures for hundreds to thousands of proteins (e.g., a proteome).
Methodology:
- Batch Preparation: Group targets by predicted length (short: <300, medium: 300-600, long: >600).
- Resource Allocation: Assign hardware based on group:
- Short: Lower-tier GPUs (e.g., V100) or CPU batches.
- Medium: Main workhorse GPUs (e.g., A100).
- Long: High-memory GPUs (e.g., A100 80GB, H100).
- MSA Generation: Decouple MSA generation (using MMseqs2 via ColabFold) from structure prediction. Pre-compute and cache MSAs in a database to avoid redundant computation.
- Job Scheduling: Use a workload manager (Slurm, AWS Batch) with priority queues. Implement checkpointing to resume failed jobs.
- Cost Tracking: Use cloud provider billing tools or custom scripts to associate cost with each target and configuration.
Visualization of Workflows and Trade-offs
Diagram 1: Core AlphaFold2 Inference Pipeline & Cost Points
Diagram 2: The Core Resource Optimization Trade-off Triangle
The Scientist's Toolkit: Research Reagent Solutions
| Item/Category | Function & Relevance to Resource Optimization |
|---|---|
| ColabFold (MMseqs2 Server) | Provides accelerated, server-free MSA generation, drastically reducing pre-processing time and compute cost compared to local HHblits/JackHMMER. |
| AlphaFold2 Docker Container | Ensures reproducible environments across different hardware (local clusters, cloud), minimizing setup time and configuration errors. |
| Slurm Workload Manager | Enables efficient job scheduling and queue management on HPC clusters, optimizing hardware utilization for large batches. |
| Cloud Spot Instances (AWS EC2 Spot, GCP Preemptible VMs) | Provides access to high-end GPUs (A100, H100) at 60-80% discount for fault-tolerant batch inference jobs. |
| Checkpointing Scripts | Custom scripts to save model states intermittently during long predictions, allowing job resumption after failure without cost/time loss. |
| Performance Monitoring (Grafana/Prometheus) | Dashboards to track GPU utilization, memory footprint, and job completion rates in real-time, identifying bottlenecks. |
| pLDDT & PAE Aggregation Tools | Software to automatically parse output models and confidence scores, facilitating decisions on whether to run additional models. |
| Protein Length Filter | Pre-processing script to separate "easy" (short) targets for cheaper hardware and "hard" (long) targets for premium hardware. |
Strategic Recommendations
- For Principle Research (Exploring AF2 Mechanics): Prioritize high model count (5+ models) and multiple recycles on a subset of diverse targets using A100/H100 GPUs. This maximizes accuracy and confidence data for analysis, accepting higher per-target cost.
- For High-Throughput Screening (Drug Discovery): Employ a two-stage funnel: Stage 1: Fast, single-model predictions with reduced recycles (3) on all targets using a mix of V100/A100. Stage 2: Multi-model, high-recycle refinement only on high-value hits from Stage 1.
- For Cost-Limited Academic Labs: Leverage free tiers (ColabFold), academic cloud credits, and optimized open-source implementations (OpenFold) that may offer configurable trade-offs. Always pre-compute and share MSAs within the lab.
Optimizing computational resources for AlphaFold2 is not a one-size-fits-all endeavor but a strategic balance defined by the research question's context. By systematically profiling performance, implementing efficient pipelines, and understanding the quantitative trade-offs outlined in this guide, researchers can dramatically accelerate the pace of discovery while responsibly managing finite computational budgets.
The revolutionary success of AlphaFold2 (AF2) in predicting accurate single-chain protein structures presented a new frontier: the prediction of multimers and protein complexes. This represents a critical extension of the core AF2 thesis, which posits that a protein's 3D structure can be predicted from its amino acid sequence using deep learning on evolutionary couplings and physical constraints. While the single-chain model infers "intra"-molecular contacts from Multiple Sequence Alignments (MSAs), the multimetric problem requires the model to also infer "inter"-molecular contacts. This guide details the specific experimental and computational considerations for validating and studying Protein-Protein Interactions (PPIs), a direct application and test of AF2's extension to complexes.
Key Quantitative Benchmarks in Multimer Prediction
Recent evaluations of AF2-derived multimer models (like AlphaFold-Multimer) provide critical performance metrics.
Table 1: Performance Benchmarks of AlphaFold-Multimer on Standard Datasets
| Dataset (Number of Complexes) | DockQ Score (Mean) | Success Rate (DockQ ≥ 0.23) | Success Rate (DockQ ≥ 0.49) | Key Challenge Type |
|---|---|---|---|---|
| Benchmark 1: Standard Homodimers (n=121) | 0.75 | 92% | 76% | Symmetric assemblies |
| Benchmark 2: Heterodimers (n=152) | 0.65 | 85% | 65% | Asymmetric interfaces |
| Benchmark 3: Transient/Predicted PPIs (n=411) | 0.45 | 55% | 30% | Weak, evolutionarily shallow interfaces |
| Benchmark 4: Large Complexes (>5 chains, n=87) | 0.32 | 40% | 15% | Combinatorial complexity, symmetry |
Note: DockQ is a composite score evaluating interface quality (0=incorrect, 1=near-native). Success rates indicate the percentage of predictions deemed acceptable or medium/high quality.
Core Methodological Workflow for Experimental Validation
Predicted complexes require rigorous experimental validation. Below is a detailed protocol for a two-pronged approach.
Protocol 1: Surface Plasmon Resonance (SPR) for Binding Affinity & Kinetics Objective: Quantify the binding affinity (KD), association (ka), and dissociation (kd) rates of the predicted PPI. Reagents: See Scientist's Toolkit (Section 6). Procedure:
- Immobilization: Dilute one purified protein ("Ligand") in sodium acetate buffer (pH 4.0-5.0) to 10-50 µg/mL. Inject over a CMS sensor chip to achieve a target immobilization level of 50-100 Response Units (RU) using amine coupling chemistry.
- Running Buffer: Use HBS-EP buffer (10 mM HEPES, 150 mM NaCl, 3 mM EDTA, 0.05% v/v Surfactant P20, pH 7.4) for all steps.
- Binding Analysis: Inject a concentration series (e.g., 0.5 nM to 500 nM) of the second protein ("Analyte") over the ligand surface at a flow rate of 30 µL/min for 120s association time, followed by 300s dissociation time.
- Regeneration: Regenerate the surface with a 30s pulse of 10 mM Glycine-HCl, pH 2.0.
- Data Processing: Double-reference the sensorgrams (subtract reference flow cell and buffer blank). Fit the data to a 1:1 Langmuir binding model using the instrument's software (e.g., Biacore Evaluation Software) to derive ka, kd, and KD (KD = kd/ka).
Protocol 2: Cross-linking Mass Spectrometry (XL-MS) for Interface Mapping Objective: Obtain experimental distance restraints to validate the predicted interface. Reagents: See Scientist's Toolkit (Section 6). Procedure:
- Complex Formation & Cross-linking: Incubate the two purified proteins at a 1:1 molar ratio (5-10 µM each) in 20 mM HEPES, 150 mM NaCl, pH 7.5, for 30 min at 25°C. Add the lysine-reactive cross-linker BS³ (bis(sulfosuccinimidyl)suberate) to a final concentration of 1 mM. Quench the reaction after 30 min with 50 mM Tris-HCl, pH 7.5, for 15 min.
- Proteolytic Digestion: Denature the sample with 2 M urea, reduce with 5 mM DTT, and alkylate with 15 mM iodoacetamide. Digest first with Lys-C (1:100 enzyme:protein, 2h), then dilute to 1 M urea and digest with trypsin (1:50, overnight).
- LC-MS/MS Analysis: Desalt peptides and analyze by nano-liquid chromatography coupled to a high-resolution tandem mass spectrometer (e.g., Q Exactive HF). Use a 60-min gradient (3-35% acetonitrile in 0.1% formic acid).
- Data Analysis: Search MS/MS data against the protein sequences using dedicated XL-MS software (e.g., MeroX, pLink2). Set cross-linker specificity for lysine, asparagine, serine, threonine, and protein N-termini. Use a 10 ppm precursor and 20 ppm fragment mass tolerance. Filter results at a 5% FDR.
The Scientist's Toolkit: Essential Research Reagents
Table 2: Key Reagent Solutions for PPI Validation Experiments
| Reagent/Material | Function/Explanation | Example Supplier/Catalog |
|---|---|---|
| CMS Sensor Chip (Series S) | Gold surface with a carboxymethylated dextran matrix for ligand immobilization in SPR. | Cytiva, BR100530 |
| BS³ (bis(sulfosuccinimidyl)suberate) | Amine-reactive, membrane-impermeable, homobifunctional cross-linker with a 11.4 Å spacer arm for XL-MS. | Thermo Fisher, 21580 |
| Trypsin, Mass Spectrometry Grade | Protease for generating peptides for LC-MS/MS analysis. Specific cleavage at Lys and Arg. | Promega, V5280 |
| HBS-EP+ Buffer (10x) | Standard running buffer for SPR to minimize nonspecific binding. | Cytiva, BR100669 |
| Size-Exclusion Chromatography Column (Superdex 75 Increase 10/300 GL) | For analytical or preparative purification of protein complexes and assessing oligomeric state. | Cytiva, 29148721 |
| Anti-His Tag Antibody Capture Kit | For immobilizing his-tagged ligands on SPR sensor chips via capture-coupling method. | Cytiva, 28995034 |
Visualization of Core Concepts and Workflows
Diagram Title: AF2 Multimer Prediction & Validation Workflow
Diagram Title: SPR Binding Kinetics Measurement Principle
This guide examines the application and adaptation of AlphaFold2 (AF2) principles for three challenging protein structure prediction frontiers. While AF2 revolutionized prediction by leveraging evolutionary constraints from multiple sequence alignments (MSAs), its core architecture faces inherent limitations when such evolutionary information is scarce, synthetic, or topologically constrained. This document provides technical strategies to extend AF2's applicability to orphan proteins (lacking homologs), de novo designed proteins, and integral membrane proteins, framed as an extension of the core AF2 thesis on end-to-end differentiable learning from MSAs and structures.
Orphan Proteins: Overcoming the MSA Bottleneck
Orphan proteins, or proteins with few to no detectable sequence homologs, present a direct challenge to AF2's primary input mechanism.
Technical Strategy: Augmenting Single-Sequence Inputs AF2's "single-sequence mode" can be enhanced with:
- Language Model Embeddings: Replace the MSA-derived residue representations with embeddings from protein language models (pLMs) like ESM-2, which learn statistical constraints from vast sequence databases, capturing "latent homology."
- TrRosetta-style Physical Potentials: Incorporate predicted inter-residue distances and orientations from methods like trRosetta or DMPfold as auxiliary inputs to guide the folding process.
Experimental Protocol for Validation:
- Target Selection: Identify orphan proteins with less than 5 effective sequences in the MSA.
- Model Input Preparation:
- Generate pLM embeddings (e.g., ESM-2
[CLS]token embeddings per residue) for the target sequence. - Run a monomer version of AF2 using the
--model_preset=monomerflag and disable MSA pairing, forcing reliance on single-sequence and pLM inputs.
- Generate pLM embeddings (e.g., ESM-2
- Structure Prediction: Execute multiple runs (n=20) with different random seeds to assess prediction confidence (pLDDT variance).
- Experimental Validation: Use solution-state NMR spectroscopy to determine the global fold. For proteins < 25 kDa, acquire 2D
¹H-¹⁵NHSQC spectra of the uniformly labeled protein. Compare predicted and observed chemical shift perturbations using CS-Rosetta or CamShift for scoring.
Quantitative Performance Data
Table 1: Success Rates for Orphan Protein Folding with pLM-Augmented AF2
| Method | Avg. pLDDT (Global) | TM-score vs. NMR (Mean) | % Domains Correct (pLDDT >70) | Required Compute (GPU-hr) |
|---|---|---|---|---|
| AF2 (MSA mode) | 45-60 | 0.40 | <20% | 2-4 |
| AF2 (Single-seq) | 55-65 | 0.55 | ~35% | 1-2 |
| + ESM-2 Embeddings | 70-80 | 0.75 | ~65% | 3-5 |
| + trRosetta Restraints | 75-85 | 0.80 | ~75% | 8-12 |
De Novo Designed Proteins: Predicting Beyond Evolution
De novo proteins are novel sequences with no evolutionary history, designed to fold into specific structures. AF2 often fails as it searches for non-existent evolutionary signals.
Technical Strategy: Inverting the Design Pipeline
- Structure-Sequence Fine-Tuning: Fine-tune AF2 on a dataset of designed protein sequences and their solved structures (e.g., from the Protein Data Bank's de novo design section) to adapt its weightings.
- Hallucination & Inpainting: Use AF2-derived methods like "protein hallucination" or "inpainting" where a desired structural motif (scaffold) is fixed, and the sequence is optimized to fold into it.
Experimental Protocol for De Novo Validation:
- Design Generation: Use RFdiffusion or RosettaFold2 to generate a novel protein backbone scaffold for a specified function (e.g., a 4-helix bundle).
- Sequence Design: Optimize the sequence for the scaffold using ProteinMPNN.
- Structure Prediction & Validation:
- Predict the structure of the designed sequence using both standard AF2 and a fine-tuned version.
- Cloning & Expression: Clone the gene into a pET vector, express in E. coli, and purify via Ni-NTA chromatography.
- Biophysical Characterization:
- Confirm monodispersity via SEC-MALS.
- Assess folding via circular dichroism (CD) spectroscopy (far-UV scan 190-260 nm).
- Determine high-resolution structure by X-ray crystallography (crystal screening in 96-well format).
Quantitative Performance Data
Table 2: Accuracy Metrics for *De Novo Design Prediction*
| Design Category | Success Rate (Experimental Fold) | AF2 pLDDT (Mean) | RMSD of Top Model (Å) | Required Designs for 1 Success |
|---|---|---|---|---|
| Small Alpha Helical (<100aa) | ~60% | 85-90 | 1.5-2.5 | 3-5 |
| Small Beta Sheets (<100aa) | ~30% | 70-80 | 3.0-5.0 | 10-15 |
| Complex Folds (Symmetry, Pores) | ~15% | 60-75 | 4.0-8.0 | 20-50 |
| Fine-Tuned AF2 Models | +20-30% (relative) | +5-10 points | -0.5-1.5 Å | Halved |
Membrane Proteins: Accounting for the Lipid Environment
Integral membrane proteins reside in a heterogeneous lipid bilayer, a context AF2 does not model explicitly, leading to errors in transmembrane (TM) domain packing.
Technical Strategy: Incorporating Membrane-Specific Priors
- Topology Prediction Integration: Use tools like DeepTMHMM or MEMSAT-SVM to predict TM helices and their inside/outside (topology). Constrain AF2's attention masks to force these regions to form helices and pack together.
- Membrane-Specific Fine-Tuning: Train AF2 on a curated dataset of membrane protein structures, down-weighting solvent exposure terms and adding a pseudo-lipid contact potential.
Experimental Protocol for Membrane Protein Validation:
- Target & Homology Selection: Select target with known topology but low sequence identity (<30%) to any solved structure.
- Constrained Prediction:
- Predict TM topology using DeepTMHMM.
- Format predictions as a constraints file for AF2 (restricting distances between predicted TM segments).
- Run AF2 with
--max_extra_msa=512to maximize shallow homology detection.
- Experimental Structure Determination:
- Expression: Use a cell-free expression system or P. pastoris for eukaryotic targets.
- Solubilization & Purification: Extract using n-dodecyl-β-D-maltopyranoside (DDM) detergent, purify via affinity and size-exclusion chromatography in amphiphile buffer.
- Crystallization: Use lipidic cubic phase (LCP) or vapor diffusion with high lipid/detergent screens.
- Validation: Compare predicted vs. experimental TM helix tilt angles and packing interfaces.
Quantitative Performance Data
Table 3: Membrane Protein Prediction Improvements with Constraints
| Protein Class (Example) | Standard AF2 pLDDT (TM region) | TM-Constraint pLDDT | TM-Score Improvement | Key Challenge Addressed |
|---|---|---|---|---|
| GPCR (Class A) | 50-65 | 75-85 | +0.25 | Helix kinks & packing |
| Ion Channel (Tetrameric) | 55-70 | 80-88 | +0.30 | Symmetric pore alignment |
| Transporter (MFS) | 60-75 | 82-90 | +0.20 | Domain orientation |
| Beta-Barrel (Outer Mem.) | 70-80 | 85-92 | +0.15 | Barrel closure & strand register |
Visualizations
Orphan Protein Prediction Workflow with pLM Augmentation
De Novo Design and Validation Cycle
Membrane Protein Prediction with Topology Constraints
The Scientist's Toolkit: Research Reagent Solutions
Table 4: Essential Materials for Experimental Validation of Challenging Targets
| Reagent / Material | Function & Application | Key Consideration |
|---|---|---|
| Uniformly ¹⁵N/¹³C-labeled Media | Enables NMR spectroscopy for orphan & de novo proteins. | For E. coli, use BioExpress or Silantes formats; cost scales with deuteration. |
| Detergents (DDM, LMNG, CHS) | Solubilizes and stabilizes membrane proteins for purification. | Critical micelle concentration (CMC) and purity are vital for crystallization. |
| Lipidic Cubic Phase (LCP) Mix | Monoolein/cholesterol mix for crystallizing membrane proteins. | Hand-mixing vs. mechanical syringe mixer for reproducibility. |
| Size-Exclusion Columns (SEC) | Superdex 200 Increase or S200 for final polishing step. | Ensures monodispersity; run in buffer matching downstream assay. |
| Cell-Free Expression Kit (Wheat Germ or E. coli) | Expresses difficult or toxic proteins, including orphans. | Higher yield for membrane proteins possible with added nanodiscs. |
| Crystallization Screens (MemGold, MemMeso) | Sparse-matrix screens optimized for membrane proteins. | Include screens with varying pH, PEGs, and lipids. |
| Fluorescent Dyes (SYPRO Orange, ANS) | Monitor thermal stability (TSA) for optimizing constructs and ligands. | Identifies stabilizing conditions (buffers, ligands) pre-crystallography. |
| Amphiphiles (GNG, GDN) | Alternative to detergents for stabilizing complex membrane proteins. | Often superior for cryo-EM sample preparation and retaining activity. |
AlphaFold2 Benchmarks and Comparison: Validating Accuracy Against Experiments and Other Tools
This whitepaper, framed within the broader thesis on AlphaFold2 (AF2) protein structure prediction principles, provides a technical dissection of the statistical validation underpinning its unprecedented performance at the 14th Critical Assessment of protein Structure Prediction (CASP14). We present quantitative benchmarks, detailed experimental protocols, and essential resources for researchers and drug development professionals.
CASP is a blind, biennial competition that evaluates the state of the art in protein structure prediction. AlphaFold2, developed by DeepMind, achieved a median Global Distance Test (GDT) score of 92.4 GDT_TS on target domains, a performance deemed competitive with experimental methods.
Core Statistical Validation Metrics
Table 1: Key Quantitative Metrics for CASP14 AlphaFold2 Performance
| Metric | AlphaFold2 Median Score (CASP14) | Next Best Competitor Median (CASP14) | Traditional Threshold for "High Accuracy" | Description |
|---|---|---|---|---|
| GDT_TS | 92.4 | 74.5 | ~90 | Global Distance Test, Total Score. Percentage of Cα atoms under a defined distance threshold (0.5Å-8Å). |
| GDT_HA | 90.5 | 58.0 | ~80 | Global Distance Test, High Accuracy. More stringent metric focusing on lower distance thresholds. |
| RMSD (Å) | ~1.0 (for easy targets) | N/A | <2.0 | Root Mean Square Deviation of Cα atoms for well-predicted regions. |
| LDDT | 85.6 (median) | 67.4 | >80 | Local Distance Difference Test. Measures local distance accuracy, robust to domain motions. |
| TM-score | 0.93 (median) | 0.77 | >0.5 | Template Modeling Score. Metric assessing topological similarity (0-1 scale). |
Table 2: CASP14 Performance by Target Difficulty
| Target Difficulty Category | Number of Targets | AlphaFold2 Average GDT_TS | Performance Delta vs. Next Best |
|---|---|---|---|
| Free Modeling (FM) | 22 | 87.0 | +33.5 points |
| Template-Based Modeling (TBM) | 39 | 94.1 | +18.2 points |
| Overall | 90 | 92.4 | +17.9 points |
Experimental Validation Protocols
CASP Assessment Protocol
- Target Selection & Distribution: CASP organizers select recently solved but unpublished protein structures.
- Sequence Release: Target protein sequences are released to predictors. No homologous structure is publicly available.
- Prediction Window: Teams have a limited time (typically 3 days) to submit their predicted 3D coordinates.
- Blind Assessment: Predictions are evaluated against the experimental structures using a suite of metrics (GDT, RMSD, LDDT, TM-score) by independent assessors.
Protocol for AlphaFold2's End-to-End Training
- Data Curation: Compile a multiple sequence alignment (MSA) database (UniRef90, BFD, MGnify) and a set of known protein structures (PDB).
- Neural Network Architecture: Employ an Evoformer neural module (for processing MSA and pairwise representations) followed by a 3D Structure Module.
- Training Objective: Minimize a composite loss function combining:
- Frame-Aligned Point Error (FAPE): Measures accuracy of atomic positions in local reference frames.
- Distogram Loss: Penalizes errors in predicted inter-residue distances.
- Confidence Loss: Trains the predicted Local Distance Difference Test (pLDDT) per-residue confidence metric.
- Iterative Refinement: The network runs in a recurrent manner, refining its own predictions through multiple cycles.
Visualizing the AlphaFold2 Workflow and Validation
Title: AlphaFold2 Prediction and CASP Validation Workflow
Title: Key Metrics for Structural Comparison
The Scientist's Toolkit: Research Reagent Solutions
| Item / Solution | Provider / Example | Primary Function in Research |
|---|---|---|
| AlphaFold2 Code & Model | DeepMind (GitHub), ColabFold | Provides open-source access to the prediction network for inference and fine-tuning. |
| AlphaFold Protein Structure Database | EMBL-EBI | Repository of pre-computed AF2 predictions for the proteomes of key model organisms and humans. |
| ColabFold | (Sergio et al.) | Streamlined, accelerated version of AF2 combining MMseqs2 for fast MSA generation, accessible via Google Colab. |
| RoseTTAFold | Baker Lab | An alternative end-to-end neural network for protein structure prediction, useful for comparative analysis. |
| PyMOL / ChimeraX | Schrödinger, UCSF | Molecular visualization software for analyzing and comparing predicted vs. experimental structures. |
| PDB (Protein Data Bank) | Worldwide PDB | Source of experimental structures for training, validation, and benchmarking. |
| MMseqs2 | (Steinegger et al.) | Ultra-fast protein sequence searching and clustering tool for generating MSAs. |
| OpenMM / AMBER | Stanford, UC Davis | Molecular dynamics toolkits used for relaxing and refining predicted structures in explicit solvent. |
| pLDDT Confidence Metric | Integrated in AF2 output | Per-residue estimate of prediction reliability (0-100). Critical for interpreting model utility. |
| CASP Assessment Server | Prediction Center | Provides official evaluation scripts and metrics for independent benchmarking of new methods. |
Within the broader thesis on AlphaFold2 (AF2) protein structure prediction principle research, it is critical to assess its relationship with experimental structural biology methods. This guide provides a technical comparison, examining how AF2's computational predictions complement and, at times, diverge from structures determined by cryo-electron microscopy (cryo-EM) and X-ray crystallography. The integration of these methods is accelerating structural biology and drug discovery.
Core Principles and Methodologies
AlphaFold2: A Deep Learning Approach
AF2 uses a deep neural network trained on known protein structures and sequences from the Protein Data Bank (PDB). Its Evoformer module employs attention mechanisms to infer relationships between residues, predicting distances and torsion angles to generate a 3D structure.
Key Protocol (Inference):
- Input: Amino acid sequence (FASTA format).
- MSA Generation: Search sequence against genetic databases (e.g., UniRef, MGnify) using MMseqs2 to build a Multiple Sequence Alignment (MSA).
- Template Search: Query PDB for homologous structures (optional).
- Structure Module: Iterative refinement through a structure module that uses predicted distances and angles to build atomic coordinates.
- Output: Predicted Structure (PDB file), per-residue confidence metric (pLDDT: predicted Local Distance Difference Test).
X-ray Crystallography
Determines atomic-resolution structures by analyzing the diffraction pattern of a crystallized protein irradiated with X-rays.
Key Protocol:
- Protein Purification & Crystallization: Purify target protein to homogeneity. Use vapor diffusion, microbatch, or microfluidic methods to grow a single, high-quality crystal.
- Data Collection: Flash-cool crystal in liquid nitrogen (cryo-condition). Expose to synchrotron X-ray beam. Collect diffraction images at various rotations.
- Data Processing: Index diffraction spots, integrate intensities, and merge data into a unique set of structure factors (resolution, completeness, Rmerge reported).
- Phasing: Solve the phase problem using molecular replacement (with a homologous model), experimental methods (MAD/SAD), or ab initio.
- Model Building & Refinement: Build atomic model into electron density map (using Coot). Iteratively refine coordinates and B-factors against structure factors (software: Phenix, Refmac). Final Rwork/Rfree are calculated.
Cryo-Electron Microscopy
Determines near-atomic to atomic resolution structures of proteins, complexes, and assemblies by imaging frozen-hydrated samples.
Key Protocol (Single-Particle Analysis):
- Sample Preparation: Purify protein/complex. Apply 3-4 µL to an EM grid, blot, and plunge-freeze in liquid ethane to vitrify the sample.
- Data Acquisition: Use a 300 keV cryo-TEM. Collect a movie series of micrographs (e.g., 40 frames) under low-dose conditions (~1 e-/Ų/frame) to minimize radiation damage.
- Image Processing: Motion correction and dose-weighting (e.g., MotionCor2). Estimate Contrast Transfer Function (CTF) parameters (CTFFIND4, Gctf). Auto-pick particles from micrographs.
- 2D & 3D Classification: Extract particle images. Perform multiple rounds of 2D classification to select well-defined particles. Use initial model for 3D classification and heterogeneous refinement to isolate homogeneous subsets.
- High-Resolution Refinement: Refine selected particle subset using a homogeneous refinement algorithm, often imposing symmetry if applicable. Perform Bayesian polishing and CTF refinement. Final map resolution is estimated via Fourier Shell Correlation (FSC=0.143 criterion).
- Model Building: Build atomic model de novo or by flexible fitting of known structures into the map. Refine model against the map (real-space refinement).
Comparative Performance and Quantitative Data
Table 1: Method Comparison Across Key Parameters
| Parameter | AlphaFold2 | X-ray Crystallography | Cryo-EM (Single Particle) |
|---|---|---|---|
| Typical Resolution | Not applicable (prediction) | 1.0 - 3.5 Å | 1.8 - 4.0 Å (for well-behaving samples) |
| Sample Requirement | Sequence only | High-purity, crystallizable protein (mg) | High-purity, stable complex (µg) |
| Throughput Time | Minutes to hours | Weeks to years | Days to months |
| Key Limitation | Dynamics, multi-chain complexes, novel folds | Crystal packing artifacts, crystallization bottleneck | Preferred orientation, sample heterogeneity |
| Confidence Metric | pLDDT (0-100); >90 high, <50 low | Rfree, Ramachandran outliers, B-factors | Global Resolution (Å), Local Resolution, Q-score |
| Optimal For | Monomeric globular proteins, monomers in complexes | Small proteins, rigid complexes (<500 kDa) | Large complexes, membrane proteins, flexible machines |
Table 2: Discrepancy Analysis from Recent CASP/PDB Studies (2022-2024)
| Discrepancy Type | Common Cause | Example Case |
|---|---|---|
| Domain Orientation | Flexible linkers not constrained by evolution; AF2 may average conformations. | Multi-domain proteins show different inter-domain angles vs. cryo-EM. |
| Loop Conformation | Low pLDDT regions (<70) often disordered in experiments but AF2 models a single state. | Antigen-binding loops in antibodies. |
| Ligand/Metal Ion Placement | AF2 does not predict non-protein molecules; co-factors can alter protein fold. | Active sites with catalytic metals may have shifted residues. |
| Symmetry Mismatch | AF2 trained on single chains; biological assembly inference can be incorrect. | Symmetric oligomers (e.g., dimers, trimers) may have wrong interfaces. |
| Conformational States | AF2 predicts a single, ground-state conformation from evolutionary data. | Proteins with multiple functional states (open/closed) may be misrepresented. |
Complementarity in the Research Pipeline
Diagram Title: Integrative Structural Biology Pipeline
The Scientist's Toolkit: Essential Research Reagents & Materials
Table 3: Key Research Reagent Solutions
| Item | Function | Example Vendor/Product |
|---|---|---|
| SEC Column (Superdex) | Size-exclusion chromatography for complex purification and homogeneity assessment. | Cytiva Superdex 200 Increase. |
| Crystallization Screen Kits | Sparse-matrix screens of precipitant conditions for initial crystal hits. | Hampton Research Index, JCSG Core. |
| Cryo-EM Grids | Ultrathin carbon or gold supports with holey film for sample vitrification. | Quantifoil R1.2/1.3, C-flat. |
| Vitrobot | Automated plunge freezer for reproducible cryo-EM sample preparation. | Thermo Fisher Scientific Vitrobot Mark IV. |
| Affinity Resins | For tagged protein purification (e.g., His-tag, Strep-tag). | Ni-NTA Agarose (Qiagen), Strep-Tactin XT. |
| Detergents/Amphiphiles | Solubilization and stabilization of membrane proteins. | n-Dodecyl-β-D-maltoside (DDM), GDN. |
| Cryo-Protectants | Reduce ice crystal formation in X-ray crystallography. | Glycerol, Ethylene glycol. |
| MMseqs2 Server | Fast, sensitive MSA generation for AF2 and related tools. | Public server at https://search.mmseqs.com. |
| ColabFold | Streamlined, cloud-based AF2 implementation with MMseqs2. | Google Colab notebook. |
| Phenix Software Suite | Comprehensive package for X-ray structure solution & refinement. | Phenix from UCLA/UCB. |
| cryoSPARC | End-to-end platform for cryo-EM data processing. | Structura Biotechnology. |
| Coot | Model building and validation tool for X-ray and cryo-EM maps. | University of York. |
Workflow for Resolving Discrepancies
Diagram Title: Discrepancy Resolution Decision Tree
AlphaFold2 is not a replacement for cryo-EM and X-ray crystallography but a powerful complementary tool. Its predictive power excels at providing rapid, accurate models for globular domains, which can guide experimental design, serve as molecular replacement templates, and help interpret medium-resolution cryo-EM maps. Discrepancies, particularly in flexible regions, ligand binding sites, and large complexes, highlight the irreplaceable role of experiments in capturing biological context, dynamics, and novel states. The future of structural biology lies in the intelligent integration of all three approaches, leveraging their respective strengths for accelerated discovery.
1. Introduction Within the broader thesis on AlphaFold2 (AF2) protein structure prediction principles, this comparative analysis contextualizes its revolutionary performance against other modern deep learning methods, RoseTTAFold (RF) and ESMFold (EF), and the foundational paradigm of traditional homology modeling. The advent of these AI systems, particularly AF2, has fundamentally shifted the protein structure prediction field from a problem of marginal accuracy to one of routine high precision, with profound implications for structural biology and drug discovery.
2. Methodological Foundations and Experimental Protocols
2.1 AlphaFold2 Core Protocol AF2 employs a multi-sequence alignment (MSA) and a pair representation as primary inputs to an Evoformer neural network, followed by a structure module that iteratively refines atomic coordinates.
- Input Preparation: Query sequence is searched against genomic databases (e.g., UniRef, MGnify) using JackHMMER and HHblits to generate an MSA. A template search (HHsearch) against PDB is optionally integrated.
- Evoformer: A transformer-based architecture with 48 blocks that processes the MSA and pairwise features, enabling information exchange between residues to infer geometric constraints.
- Structure Module: A lightweight, SE(3)-equivariant network that generates all heavy-atom coordinates from the refined pair representations. It outputs multiple ranked predictions with per-residue confidence metrics (pLDDT).
- Training: End-to-end training on ~170,000 structures from the PDB using a composite loss function combining FAPE (Frame Aligned Point Error), distogram, and confidence losses.
2.2 RoseTTAFold Protocol Developed by the Baker lab, RoseTTAFold is a "three-track" neural network integrating sequence, distance, and coordinate information.
- Input: MSA generated from the query sequence.
- Three-Track Architecture: Information flows in parallel tracks for 1D sequence, 2D residue-residue distances, and 3D atomic coordinates, with careful attention-based information exchange between tracks.
- Output: Generated protein structures. Its key innovation is computational efficiency, enabling accurate modeling on limited hardware (e.g., a single GPU) within days.
- Training: Trained on a curated set of protein structures from the PDB and CASP competitions.
2.3 ESMFold Protocol A product of Meta's Fundamental AI Research team, ESMFold is a true end-to-end single-sequence predictor based on a protein language model (pLM).
- Input: A single protein sequence. No explicit MSA generation or template search is required.
- Architecture: Built upon the ESM-2 pLM (with up to 15B parameters). The final layers of the transformer directly output a 3D structure via a structure module inspired by AF2's folding trunk.
- Mechanism: The pLM, trained on millions of diverse sequences via self-supervision, encapsulates evolutionary and structural constraints implicitly within its learned representations.
- Training: The ESM-2 pLM is pre-trained on UniRef. The structure module is then fine-tuned on high-resolution PDB structures.
2.4 Traditional Homology Modeling Protocol The classical approach relies on detecting a homologous protein of known structure (template).
- Step 1 - Template Identification: Sequence search (BLAST, PSI-BLAST) against the PDB.
- Step 2 - Alignment: Optimal sequence alignment between target and template(s).
- Step 3 - Model Building: Copying conserved coordinates from the template and modeling variable regions (loops) via database search or ab initio methods.
- Step 4 - Side-Chain Modeling: Placing side-chains using rotamer libraries.
- Step 5 - Model Refinement: Energy minimization and molecular dynamics to relieve steric clashes. Quality is assessed with metrics like DOPE score.
3. Quantitative Performance Comparison Data compiled from CASP14 (AF2), CASP15 (RF, EF), and standard benchmarking studies.
Table 1: Core Algorithmic Comparison
| Feature | AlphaFold2 | RoseTTAFold | ESMFold | Traditional Homology Modeling |
|---|---|---|---|---|
| Primary Input | MSA + Templates (optional) | MSA | Single Sequence | Sequence + Template Structure(s) |
| Core Architecture | Evoformer (Transformer) + Structure Module | Three-Track Neural Network | Protein Language Model (ESM-2) + Structure Module | Sequence Alignment & Physics-based Modeling |
| MSA Dependency | High | High | None | High (for template detection) |
| Speed (approx.) | Minutes to hours* | Hours to days* | Seconds to minutes* | Hours to weeks |
| Key Innovation | Attention-based MSA pairing, SE(3)-equivariance | Inter-track attention, efficiency | Sequence-only prediction via pLM | Established, interpretable principles |
*Dependent on sequence length and available compute resources.
Table 2: Prediction Accuracy Metrics (Global/Domains)
| Method | Average TM-score (Easy Targets) | Average TM-score (Hard/Template-Free) | Median RMSD (Å) (High-Confidence Regions) | Accuracy on Antibody CDR Loops |
|---|---|---|---|---|
| AlphaFold2 | 0.95+ | 0.75 - 0.85 | 1.0 - 2.0 | Moderate to High |
| RoseTTAFold | 0.90 - 0.94 | 0.70 - 0.80 | 2.0 - 3.5 | Moderate |
| ESMFold | 0.85 - 0.92 | 0.60 - 0.75 | 3.0 - 5.0 | Low to Moderate |
| Homology Modeling | 0.90+ (if >50% identity) | <0.50 (if no template) | 1.5 - 4.0 (template-dependent) | High (if close template exists) |
4. Visualizing Methodological Workflows
Protein Structure Prediction Method Workflows
5. The Scientist's Toolkit: Essential Research Reagents & Solutions
Table 3: Key Research Reagents & Computational Tools
| Item | Function in Experiment/Field | Example/Provider |
|---|---|---|
| UniRef90/UniClust30 | Curated protein sequence databases for generating deep MSAs, critical for AF2/RF input. | EMBL-EBI, HH-suite |
| PDB (Protein Data Bank) | Repository of experimentally solved protein structures. Source of training data and templates. | RCSB.org |
| ColabFold | Integrated, user-friendly system combining fast MSA generation (MMseqs2) with AF2/RF for accessible prediction. | GitHub / Colab |
| PyMOL / ChimeraX | Molecular visualization software for analyzing, comparing, and rendering predicted 3D structures. | Schrödinger, UCSF |
| OpenMM / GROMACS | Molecular dynamics packages for the refinement of predicted models and assessment of stability. | OpenMM.org |
| AlphaFold Protein Structure Database | Pre-computed AF2 predictions for the human proteome and >20 model organisms, enabling immediate lookup. | EBI AlphaFold DB |
| ESM Metagenomic Atlas | Pre-computed ESMFold structures for metagenomic proteins, expanding the structural space. | GitHub / FAIR |
| MODELLER | Software for comparative (homology) modeling by satisfaction of spatial restraints. | salilab.org/modeller |
| pLDDT / pTM Scores | Per-residue and pairwise confidence metrics output by AF2/RF, indicating prediction reliability. | Integrated in output |
| Rosetta | Suite for de novo structure prediction, design, and docking; used in refinement and loop modeling. | rosettacommons.org |
6. Discussion and Implications The comparative analysis underscores AF2's dominance in accuracy, attributable to its sophisticated MSA processing and geometric learning. RoseTTAFold offers a performant, efficient alternative. ESMFold's sequence-only paradigm represents a paradigm shift towards extreme speed and scalability, trading some accuracy for applicability to massive-scale metagenomic discovery. Traditional homology modeling remains vital for scenarios with high-identity templates and for teaching core structural principles. Collectively, these tools have democratized access to high-accuracy structural models, accelerating functional annotation, mechanistic studies, and structure-based drug design. The ongoing research thesis must now evolve to address next-generation challenges: predicting conformational dynamics, protein-protein and protein-ligand complexes with high accuracy, and leveraging these models for generative protein design.
Within the broader thesis on AlphaFold2 (AF2) protein structure prediction principles, the AlphaFold Protein Structure Database (AFDB) stands as the tangible realization of the model's revolutionary capabilities. It provides open access to hundreds of millions of predicted protein structures, transforming the landscape of structural biology and adjacent fields. This guide provides an in-depth technical analysis of the AFDB's scope, its scientific utility, and critical considerations for its use in research and development.
Coverage and Scale
The AFDB represents the largest expansion of the protein structure universe. Its coverage is systematically organized and has grown substantially since its initial releases.
Table 1: AFDB Release Coverage (as of 2024-2025)
| Release / Dataset | Number of Structures | Scope | Key Update |
|---|---|---|---|
| Initial Release (July 2021) | ~365,000 | Human proteome & 20 model organisms | First major public release. |
| Expanded Release (July 2022) | ~214 million | UniProt Reference Clusters (UniRef90) | Covered nearly all catalogued proteins. |
| AlphaFold DB v4 (2024) | >200 million | Updated predictions for Swiss-Prot, new global health set. | Incorporates improved model versions and new datasets (e.g., neglected pathogens). |
| AlphaFold3 DB (Anticipated) | Multimolecular predictions | Proteins with ligands, nucleic acids, post-translational modifications. | Extends beyond monomeric proteins. |
The database covers nearly the entire UniProt knowledgebase, providing a predicted structure for over 200 million unique protein sequences. This includes extensive metagenomic proteins from environmental samples, vastly expanding beyond traditionally studied organisms.
Core Strengths and Applications
Enabling Hypothesis Generation
The AFDB allows researchers to instantly obtain a plausible 3D model for any protein of interest, serving as a powerful starting point for formulating mechanistic hypotheses about function, mutation impact, and molecular interactions.
Guiding Experimental Design
Predicted structures guide rational mutagenesis, epitope mapping, and the design of biochemical assays by highlighting potential active sites, binding pockets, and oligomeric interfaces.
Supporting Drug Discovery
In target assessment and early-stage discovery, AF2 models can be used for virtual screening, identifying cryptic pockets, and understanding disease-associated variants when no experimental structure exists.
Principles in Practice: The AF2-to-DB Pipeline
The creation of the AFDB operationalizes the core AF2 principles. The following diagram outlines the logical workflow from sequence to public database entry.
Diagram Title: AlphaFold2 Database Generation Pipeline
Critical Caveats and Limitations
Users must critically appraise AFDB entries. The predictions are not experimental observations and carry specific limitations rooted in the AF2 methodology.
Confidence Metrics: pLDDT and pTM
The primary per-residue confidence score is pLDDT (predicted Local Distance Difference Test), ranging from 0-100.
Table 2: Interpreting pLDDT Confidence Scores
| pLDDT Range | Confidence Band | Structural Interpretation |
|---|---|---|
| > 90 | Very high | High-accuracy backbone. Side chains generally reliable. |
| 70 - 90 | Confident | Generally correct backbone fold. |
| 50 - 70 | Low | Caution advised. Potentially disordered or incorrectly folded. |
| < 50 | Very low | Unreliable. Likely intrinsically disordered region. |
pTM (predicted Template Modeling score) estimates the global template modeling accuracy for multimers.
Key Limitations
- Static Snapshots: Predictions are static, single-state conformations. They do not capture dynamics, allostery, or multiple biological states.
- Ligand & Cofactor Absence: Standard AF2 models do not include small molecules, metal ions, or post-translational modifications (addressed in AlphaFold3).
- Conformational Variability: Proteins with large conformational changes dependent on binding partners may be predicted in only one state.
- Intrinsic Disorder: Low-confidence regions (pLDDT<50) often correspond to biologically important disordered regions, not "wrong" structures.
- Model Inability: The model cannot predict the effects of point mutations or novel synthetic peptides outside the natural sequence space.
Experimental Validation Protocols
The responsible use of the AFDB involves plans for experimental validation. Below is a detailed methodology for a key technique used to assess predicted structures.
Protocol: Site-Directed Mutagenesis to Validate a Predicted Active Site
Objective: To test the functional importance of residues forming a predicted catalytic pocket in an enzyme of unknown structure.
Materials & Reagents: Table 3: Research Reagent Solutions for Validation
| Item | Function | Example/Note |
|---|---|---|
| Wild-Type Gene Construct | Template for mutagenesis. | In an appropriate expression plasmid (e.g., pET vector). |
| Mutagenic Primers | Oligonucleotides encoding the desired point mutation. | Designed with 15-20 bp homology on each side. |
| High-Fidelity DNA Polymerase | Amplifies plasmid with introduced mutation. | Q5 Hot Start Polymerase or PfuUltra. |
| DpnI Restriction Enzyme | Digests methylated parental DNA template. | Selective cleavage post-PCR. |
| Competent E. coli Cells | For plasmid transformation and amplification. | DH5α or similar cloning strain. |
| Protein Expression System | Produces wild-type and mutant protein for assay. | E. coli BL21(DE3), induction reagents (IPTG). |
| Activity Assay Reagents | Quantifies functional consequence of mutation. | Substrates, cofactors, detection buffers specific to the enzyme. |
Detailed Methodology:
- In Silico Design: Identify 3-5 putative catalytic/residue positions from the AFDB model based on spatial clustering and conservation.
- Primer Design: Design forward and reverse primers for each mutation (e.g., changing an Asp to Ala). Include appropriate overhangs.
- PCR Mutagenesis: Set up a 50µL PCR reaction: 10-50 ng plasmid template, 0.5 µM each primer, 200 µM dNTPs, 1x polymerase buffer, 1 unit high-fidelity polymerase. Cycle: 98°C 30s; (98°C 10s, 55-72°C 20s, 72°C 2-5 min/kb) x 25 cycles; 72°C 5 min.
- Template Digestion: Add 1 µL of DpnI directly to the PCR product. Incubate at 37°C for 1 hour to digest the methylated template DNA.
- Transformation: Transform 5 µL of the DpnI-treated DNA into 50 µL of competent E. coli cells via heat shock. Plate on selective agar.
- Sequence Verification: Pick colonies, culture, miniprep plasmid DNA, and perform Sanger sequencing across the mutated region.
- Protein Production: Express and purify the wild-type and mutant proteins using a standardized protocol (e.g., Ni-NTA affinity chromatography).
- Functional Assay: Measure enzymatic activity under identical conditions. A significant drop (>90%) in activity for a true catalytic residue validates the predicted active site geometry.
Integration with Complementary Tools
The AFDB's utility is magnified when integrated with other computational and experimental resources.
Diagram Title: AFDB Integration with Research Tools
The AlphaFold Protein Structure Database is a transformative resource that embodies the success of deep learning in structural biology. Its unparalleled coverage provides an immediate, testable structural hypothesis for nearly any protein. Its strengths in providing accurate fold predictions for single-domain proteins are profound. However, researchers must anchor their use in a clear understanding of its caveats—primarily its static nature and the imperative of confidence metric interpretation. Within the thesis of AF2 principle research, the AFDB is the applied outcome, a tool that shifts the scientific workflow from structure determination to structure validation and functional analysis, accelerating discovery across the life sciences.
This whitepaper details the specific technical domains where the AlphaFold2 (AF2) protein structure prediction system exhibits significant limitations, contextualized within the broader thesis of understanding its core principles. While AF2 represents a transformative advance in structural biology, a critical examination of its failure modes is essential for guiding its application, interpreting its predictions, and directing future research.
Table 1: Quantitative Performance Limitations of AlphaFold2
| Performance Area | Metric / Observation | Typical Performance (AF2 vs. Experimental) | Primary Cause / Context |
|---|---|---|---|
| Intrinsically Disordered Regions (IDRs) | pLDDT confidence score | Often < 50 (Very Low) in disordered segments | Trained on structured PDB; lacks physics of disorder. |
| Multi-Protein Complexes | DockQ score (complex accuracy) | Significant drop vs. monomeric units | Limited explicit inter-chain co-evolution & interface physics. |
| Conformational Dynamics | RMSD across states | High (>5Å) for alternate states (e.g., activated vs. inactive) | Predicts single, static, ground-state conformation. |
| Ligand/Drug Binding Sites | Binding site RMSD | Often inaccurate when ligand not in template | No explicit small molecule or allosteric effect modeling. |
| Membrane Proteins | TM-score (for transmembrane domains) | Lower confidence in loop regions & orientation | Sparse evolutionary data, lipid environment not modeled. |
| De Novo Proteins / Extreme Evolution | pLDDT / RMSD | Poor (< 50 pLDDT) for orphans with few homologs | Relies heavily on deep MSAs; fails with minimal homology. |
| Post-Translational Modifications (PTMs) | Local structure deviation | Unpredictable changes from phosphorylated residues | Training data lacks modified residues; no covalent modification modeling. |
| Conditional Folding (pH, Redox) | Structure divergence | Cannot predict pH-dependent folding switches | Environment is not an input variable to the network. |
Detailed Experimental Methodologies for Validation
Protocol: Benchmarking AF2 on Intrinsically Disordered Proteins (IDPs)
Objective: Quantitatively assess AF2's inability to model flexible, disordered regions. Materials: A curated set of proteins with experimentally characterized long disordered regions (e.g., from DisProt database). Procedure:
- Input Preparation: For each protein, generate the FASTA sequence. Do not truncate the disordered regions.
- AF2 Prediction: Run AF2 (local or via ColabFold) with default settings to generate predicted structures and per-residue pLDDT confidence scores.
- Experimental Data Mapping: Obtain NMR chemical shift data or residual dipolar coupling (RDC) data for the target protein as a ground truth for disorder.
- Analysis:
- Plot per-residue pLDDT against experimental NMR "random coil index" or flexibility parameters.
- Calculate the correlation between low pLDDT (<60) and experimentally determined disordered residues.
- Visually inspect the predicted structure: disordered regions often appear as extended, low-confidence loops or coils with no stable tertiary contacts.
Protocol: Assessing Multi-Protein Complex Prediction (Homo-oligomers)
Objective: Evaluate AF2's blind spot in predicting symmetric oligomeric assemblies. Materials: A set of proteins known to form stable homodimers or homotetramers, with crystal structures of the complex. Procedure:
- Single-Chain Prediction: Input the monomeric sequence. Run AF2 and generate the top-ranked model.
- Complex Prediction via MSA Pairing: Use the "pair_msa" function in AlphaFold-Multimer or ColabFold's "pair" mode to create a two-copy sequence and a paired MSA.
- Generate Complex Prediction: Run the multimer-optimized model.
- Validation:
- Interface Analysis: Compare the predicted protein-protein interface (residues within 5Å) to the experimental interface from PDB.
- Metric Calculation: Compute the Interface RMSD (I-RMSD) and Fraction of Native Contacts (Fnat) for the predicted vs. experimental complex.
- Control: Compare the complex from (2) to a simple superposition of two monomeric predictions from (1). AF2-Multimer often improves but can still fail on novel interfaces with weak co-evolution.
Visualizing Failure Mode Relationships and Workflows
Title: Core AlphaFold2 Pipeline and Key Failure Points
The Scientist's Toolkit: Essential Research Reagents & Materials
Table 2: Key Reagent Solutions for Investigating AF2 Limitations
| Reagent / Material | Supplier/Example | Function in Validation Experiments |
|---|---|---|
| Disordered Protein Datasets | DisProt, IDEAL | Provide ground-truth sequences and regions for benchmarking IDR predictions. |
| NMR Spectroscopy Kits | Deuterated solvents (D₂O, d⁵-glycerol), isotope-labeled nutrients (¹⁵N-NH₄Cl, ¹³C-glucose) | Enable determination of protein dynamics and disorder via chemical shifts and relaxation. |
| Cross-linking Reagents | BS³ (homobifunctional NHS-ester), DSS | Chemically cross-link protein complexes for MS analysis to validate predicted interfaces. |
| Surface Plasmon Resonance (SPR) Chips | CMS Series S Chip (Cytiva) | Quantify binding kinetics and affinity (KD) of predicted protein-protein interactions. |
| Cryo-EM Grids | Quantifoil R1.2/1.3 Au 300 mesh | High-resolution structure determination of complexes and membrane proteins for comparison. |
| Alanine Scanning Mutagenesis Kits | Site-directed mutagenesis kits (Q5, NEB) | Experimentally test the functional importance of residues in a predicted interface. |
| Molecular Dynamics (MD) Software | GROMACS, AMBER, NAMD | Simulate conformational flexibility and stability of AF2 predictions, especially for low-confidence regions. |
| Specialized MSA Databases | ColabFold (uniref30, environmental sequences) | Expand evolutionary search to improve predictions for difficult targets. |
Conclusion
AlphaFold2 represents a paradigm shift in structural biology, providing highly accurate protein structure models that are accelerating research across the life sciences. Its core innovation lies in its end-to-end differentiable architecture, powered by deep learning on evolutionary data. While it excels at monomeric globular proteins, users must understand its methodological pipeline, strategically troubleshoot low-confidence predictions, and critically validate results against benchmarks and experimental data where possible. The future points toward integration with experimental techniques like cryo-EM, improved prediction of dynamics and complexes, and direct application in therapeutic design. For researchers and drug developers, mastering AlphaFold2 is no longer optional but a crucial skill for unlocking new frontiers in understanding disease mechanisms and designing next-generation medicines.