The Central Dogma Decoded: From DNA to Functional Proteins in Modern Biomedical Research
This comprehensive review examines the contemporary understanding of the central dogma of molecular biology—the directional flow of genetic information from DNA to RNA to protein—within the context of cutting-edge research...
The Central Dogma Decoded: From DNA to Functional Proteins in Modern Biomedical Research
Abstract
This comprehensive review examines the contemporary understanding of the central dogma of molecular biology—the directional flow of genetic information from DNA to RNA to protein—within the context of cutting-edge research and therapeutic development. Targeting researchers, scientists, and drug development professionals, the article explores foundational principles, state-of-the-art methodologies for studying gene expression, common experimental challenges and their solutions, and robust validation frameworks. It synthesizes recent advancements, including insights into non-canonical information flow, and discusses their profound implications for precision medicine, novel therapeutic modalities, and the next generation of biomedical discovery.
The Genetic Blueprint: Revisiting the Central Dogma in the Era of Epigenetics and RNA Biology
The flow of biological information from DNA to RNA to protein is the central dogma of molecular biology, a conceptual framework foundational to all life sciences. This whitepaper provides an in-depth technical examination of the three core processes—DNA replication, transcription, and translation—that execute this information flow. Framed within ongoing research into the fidelity, regulation, and therapeutic targeting of these pathways, this guide is intended for researchers and drug development professionals seeking a consolidated, current, and methodologically detailed reference.
DNA Replication: The Semiconservative Duplication
DNA replication is the process by which a cell duplicates its entire genome prior to division, ensuring genetic continuity. It is a highly accurate, semi-conservative, and bidirectional process involving a complex replisome machinery.
Key Machinery and Mechanism
The replisome is assembled at origins of replication. Key components include:
- Helicase: Unwinds the DNA double helix.
- Single-Strand Binding Proteins (SSBs): Stabilize unwound strands.
- Topoisomerase: Relieves torsional strain ahead of the replication fork.
- Primase: Synthesizes short RNA primers.
- DNA Polymerase δ/ε: Extends primers on the lagging/leading strands.
- DNA Polymerase α: Has primase activity.
- Proliferating Cell Nuclear Antigen (PCNA): A sliding clamp that increases processivity.
- Flap Endonuclease 1 (FEN1), DNA Ligase I: Process and seal Okazaki fragments on the lagging strand.
Fidelity is maintained by the 3'→5' exonuclease proofreading activity of replicative polymerases and post-replication mismatch repair (MMR) systems.
Quantitative Metrics of Fidelity and Kinetics
Recent studies utilizing next-generation sequencing to map replication errors have refined our understanding of replication fidelity.
Table 1: DNA Replication Fidelity and Kinetics in Human Cells
| Metric | Typical Value / Rate | Experimental Context / Notes |
|---|---|---|
| Base Substitution Error Rate | ~10⁻⁷ to 10⁻⁹ per base pair | After proofreading & MMR; varies by sequence context. |
| Replication Fork Speed | 1-2 kb/minute | Measured via DNA fiber assay; can be stalled by damage. |
| Okazaki Fragment Length | 100-200 nucleotides | In eukaryotes; determined by primer initiation frequency. |
| dNTP Incorporation Rate | ~50 nucleotides/second | For Pol δ/ε in vitro. |
| Origin Density | 1 per 50-100 kb | In mammalian cells; origins are licensed but fire stochastically. |
Experimental Protocol: DNA Fiber Assay for Fork Dynamics
This assay visualizes individual replication tracts to measure fork progression and stability.
Materials:
- Cells: Asynchronously growing cells.
- Nucleotide Analogues:
- IdU (Iododeoxyuridine): Thymidine analogue, first label.
- CldU (Chlorodeoxyuridine): Thymidine analogue, second label.
- Lysis Buffer: 0.5% SDS, 200 mM Tris-HCl (pH 7.4), 50 mM EDTA.
- Primary Antibodies: Mouse anti-BrdU/CldU, Rat anti-BrdU/IdU.
- Secondary Antibodies: Alexa Fluor 488 anti-rat, Alexa Fluor 555 anti-mouse.
Method:
- Pulse-Labeling: Incubate cells with IdU (25 µM) for 20 minutes. Wash thoroughly.
- Second Pulse-Labeling: Incubate cells with CldU (250 µM) for 20 minutes.
- Harvest & Lysis: Trypsinize cells, wash in PBS. Resuspend at low density (~1,000 cells/µL) in PBS. Mix 2.5 µL cell suspension with 7.5 µL lysis buffer on a glass slide. Incubate for 8 minutes.
- Fiber Stretching: Tilt slide to spread DNA fibers. Air dry and fix in 3:1 methanol:acetic acid for 10 minutes.
- Denaturation & Immunostaining: Treat with 2.5M HCl for 1 hour. Neutralize with borate buffer. Block with BSA, then incubate with primary antibodies (1 hour), followed by fluorescent secondary antibodies (45 minutes).
- Imaging & Analysis: Visualize using fluorescence microscopy. Measure lengths of IdU-only (red), CldU-only (green), and continuous (red-green-yellow) tracts. Convert pixel lengths to kilobases using known standards.
Transcription: DNA to RNA Synthesis
Transcription is the synthesis of an RNA molecule complementary to a DNA template strand, catalyzed by RNA polymerase. It is the first step in gene expression and is tightly regulated.
The Transcriptional Machinery
Eukaryotic transcription involves three RNA polymerases:
- RNA Polymerase II (Pol II): Transcribes all protein-coding genes (mRNA) and most snRNAs/miRNAs.
- General Transcription Factors (GTFs): TFIIA, B, D, E, F, H assemble at the core promoter to form the Pre-Initiation Complex (PIC).
- Mediator Complex: Bridges enhancer-bound activators and the PIC.
- Elongation Factors & RNA Processing Complexes: Coupled capping, splicing, and polyadenylation.
Quantitative Metrics of Transcription
Table 2: Transcription Kinetics and Output in Human Cells
| Metric | Typical Value / Rate | Notes |
|---|---|---|
| Pol II Transcription Rate | ~1-4 kb/minute | Measured by genomic run-on assays; gene-specific. |
| mRNA Half-life | Minutes to >24 hours | Median ~9 hours in human cells; key regulatory point. |
| Pol II Density at Promoter | ~1-5 molecules/gene | Varies with expression level and state. |
| Pre-mRNA Splicing Efficiency | >95% for constitutive introns | Alternative splicing generates diversity. |
| Average Gene Length | ~50-100 kb (including introns) | Only ~1.5 kb is coding sequence (CDS). |
Experimental Protocol: Chromatin Immunoprecipitation Sequencing (ChIP-seq) for Pol II Occupancy
This protocol maps the genome-wide binding sites and occupancy of RNA Polymerase II.
Materials:
- Crosslinking Reagent: 1% Formaldehyde.
- Cell Lysis Buffers: LB1, LB2, LB3 (with detergents).
- Sonication Device: Covaris or Bioruptor.
- Antibody: High-specificity antibody against Pol II (e.g., anti-RPB1 N-terminal).
- Protein A/G Magnetic Beads.
- Elution & Reverse Crosslinking Buffer: 1% SDS, 0.1M NaHCO3.
- DNA Purification Kit: Silica membrane columns.
- Library Prep Kit & Sequencer: For Illumina platforms.
Method:
- Crosslinking: Treat cells (~10⁷) with 1% formaldehyde for 10 min at room temperature. Quench with 125 mM glycine.
- Cell Lysis & Sonication: Wash cells, resuspend in LB1, incubate on ice. Pellet, resuspend in LB2, incubate. Pellet, resuspend in LB3. Sonicate to shear chromatin to 200-500 bp fragments. Clarify by centrifugation.
- Immunoprecipitation: Pre-clear lysate with beads. Incubate supernatant with anti-Pol II antibody overnight at 4°C. Add protein A/G beads for 2 hours. Wash beads sequentially with low salt, high salt, LiCl, and TE buffers.
- Elution & Decrosslinking: Elute complexes with elution buffer (1% SDS, 0.1M NaHCO3). Add NaCl to 200 mM and incubate at 65°C overnight to reverse crosslinks. Treat with RNase A and Proteinase K.
- DNA Purification & Analysis: Purify DNA using a silica column. Quantify. Prepare sequencing library and sequence on Illumina platform. Align reads to reference genome and call peaks.
Translation: RNA to Protein Synthesis
Translation is the ribosomal synthesis of a polypeptide chain directed by the sequence of an mRNA molecule, using tRNAs as adaptors. It occurs in the cytoplasm and is divided into initiation, elongation, termination, and ribosome recycling.
The Translational Machinery
- Ribosome: 80S complex (60S & 40S subunits) composed of rRNA and ribosomal proteins.
- Initiation Factors (eIFs): >12 factors, including eIF4F (cap-binding complex), eIF2 (delivers Met-tRNAi), and eIF3 (scaffold).
- Elongation Factors: eEF1A (delivers aminoacyl-tRNA), eEF2 (translocates ribosome).
- Release Factors: eRF1 and eRF3 mediate termination.
- tRNAs: Charged with cognate amino acids by aminoacyl-tRNA synthetases.
Quantitative Metrics of Translation
Table 3: Translation Efficiency and Kinetics in Eukaryotes
| Metric | Typical Value / Rate | Notes |
|---|---|---|
| Translation Elongation Rate | ~5-6 amino acids/second | In mammalian cells; codon-dependent. |
| Ribosome Density | ~1 ribosome per 100-200 nt of CDS | Varies with translation efficiency. |
| Translation Initiation Rate | Limits overall protein synthesis | Subject to extensive regulation (eIF2α phosphorylation, 4E-BPs). |
| tRNA Charging Accuracy | Error rate < 10⁻⁴ | High fidelity of aminoacyl-tRNA synthetases. |
| Global Protein Half-life | Minutes to weeks | Median ~46 hours in mammalian cells; regulated by ubiquitin-proteasome system. |
Experimental Protocol: Ribosome Profiling (Ribo-seq)
This technique provides a genome-wide, quantitative snapshot of active translation by sequencing ribosome-protected mRNA fragments.
Materials:
- Cycloheximide (CHX): 100 µg/mL final concentration to stall elongating ribosomes.
- Lysis Buffer: 20 mM Tris-HCl (pH 8.0), 150 mM NaCl, 5 mM MgCl₂, 1% Triton X-100, 1 mM DTT, 100 µg/mL CHX, RNase inhibitors.
- RNase I: To digest unprotected mRNA.
- Micrococcal Nuclease (MNase): Alternative nuclease.
- Sucrose Cushion: For ribosome purification via ultracentrifugation.
- RNA Extraction & Size Selection: Acid-phenol:chloroform, followed by gel or bead-based size selection for ~28-30 nt fragments.
- Library Prep Kit: Specialized for small RNAs, includes rRNA depletion.
Method:
- Harvest & Lysis: Rapidly treat cells with CHX, wash, and lyse in ice-cold lysis buffer. Clarify lysate by centrifugation.
- Ribosome Digestion: Treat lysate with RNase I (or MNase) for 45 min at room temperature to digest exposed mRNA. Quench reaction.
- Ribosome Recovery: Purify ribosomes (and protected fragments) by centrifugation through a sucrose cushion or using size-exclusion columns.
- RNA Fragment Isolation: Extract total RNA from the ribosome pellet. Isolate RNA fragments of ~28-30 nucleotides by gel electrophoresis or magnetic beads.
- Library Construction & Sequencing: Deplete rRNA. Convert RNA fragments to a DNA library suitable for Illumina sequencing. Sequence to high depth.
- Data Analysis: Align reads to the transcriptome. The 5' end of each read corresponds to the ribosome's leading edge, allowing precise mapping of ribosome occupancy (codon-resolution).
The Scientist's Toolkit: Core Research Reagents
Table 4: Essential Reagents for Studying the Central Dogma Pathways
| Reagent / Solution | Core Function | Example Application |
|---|---|---|
| dNTP/NTP Mixes | Substrates for DNA/RNA polymerases. | PCR, in vitro transcription, replication assays. |
| Modified Nucleotides (BrdU, EdU, EU) | Thymidine/Uridine analogs for pulse-labeling. | DNA replication (fiber assay), nascent RNA detection (Click-iT). |
| RNA Polymerase Inhibitors (α-Amanitin, Actinomycin D) | Specific inhibition of RNA Pol II/global transcription. | Studying transcription dynamics, blocking gene expression. |
| Protein Synthesis Inhibitors (Cycloheximide, Puromycin, Harringtonine) | Block translation elongation/initiation. | Ribosome profiling (CHX), measuring protein half-lives, run-off assays. |
| Crosslinkers (Formaldehyde, DSG) | Fix protein-DNA/RNA interactions in vivo. | ChIP-seq, CLIP-seq experiments. |
| High-Fidelity DNA Polymerases (Phusion, Q5) | Accurate DNA synthesis with proofreading. | Cloning, site-directed mutagenesis. |
| Reverse Transcriptases (SuperScript IV, M-MLV) | Synthesize cDNA from RNA templates. | RNA-seq, RT-qPCR. |
| Ribonucleoside Vanadyl Complex (RVC) | Potent RNase inhibitor. | Protecting RNA during immunoprecipitation or cell fractionation. |
| Protease & Phosphatase Inhibitor Cocktails | Prevent post-lysis degradation/modification. | Protein extraction for western blot, IP. |
| Magnetic Beads (Protein A/G, Streptavidin) | Solid-phase immobilization of biomolecules. | Immunoprecipitation, pull-down assays, library prep. |
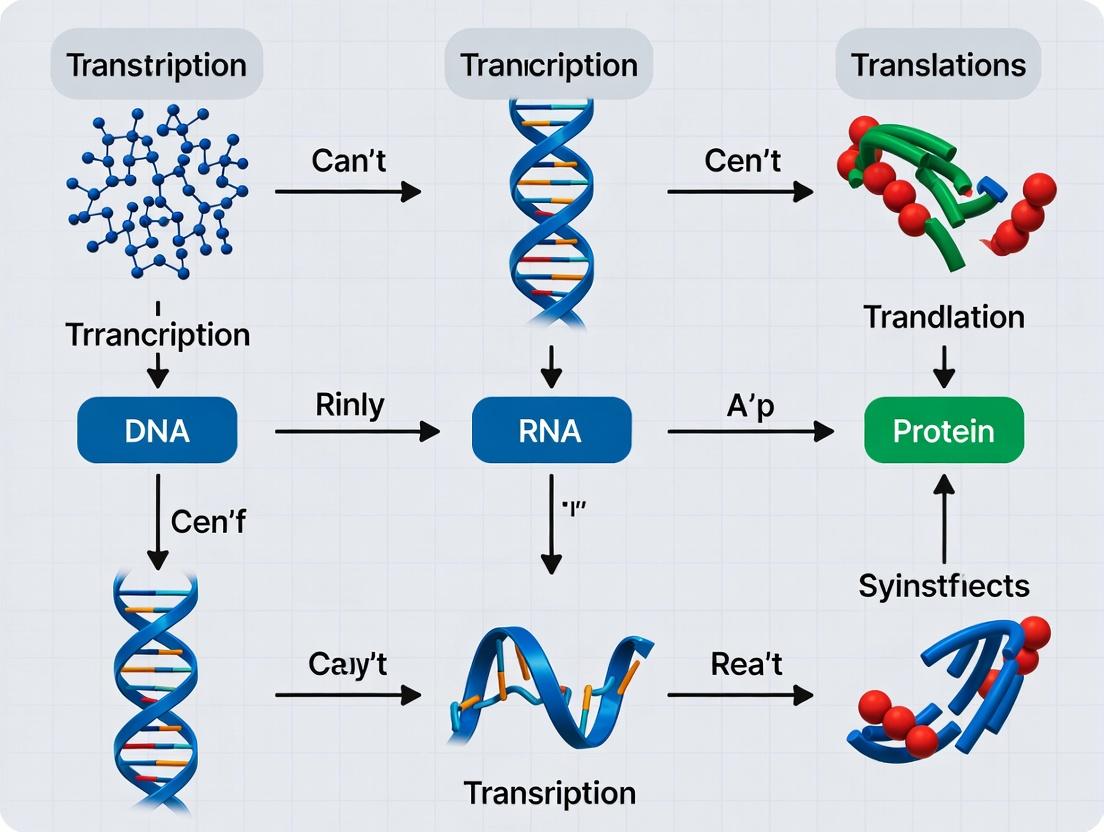
This whitepaper details the core machinery governing the central dogma of molecular biology, the flow of genetic information from DNA to RNA to protein. Within the context of ongoing research into this fundamental pathway, we provide a technical guide to the key molecular players: the polymerases that transcribe DNA, the ribosomes that translate RNA, and the regulatory factors that precisely control each step. Understanding their structure, function, and regulation is paramount for biomedical research and therapeutic intervention.
The Transcription Machinery: DNA-Dependent RNA Polymerases
DNA-dependent RNA polymerases (RNAPs) are multi-subunit enzymes responsible for synthesizing RNA from a DNA template. In eukaryotes, RNA polymerase II (Pol II) transcribes all protein-coding genes.
Key Subunits and Functions:
- Rpb1: Largest subunit; contains the catalytic site and the C-terminal domain (CTD) critical for co-transcriptional regulation.
- Rpb2: Forms the polymerase active center wall.
- Rpb3/Rpb11: Heterodimer involved in assembly.
Regulatory Factors:
- General Transcription Factors (GTFs: TFIIA, B, D, E, F, H): Required for promoter recognition and initiation.
- Mediator Complex: Integrates regulatory signals from enhancers to the pre-initiation complex.
- P-TEFb (CDK9/Cyclin T): Phosphorylates Pol II CTD to promote elongation.
- NELF/DSIF: Complexes that regulate promoter-proximal pausing.
Table 1: Core RNA Polymerase Complexes Across Domains
| Polymerase | Organism Type | Core Subunits | Primary Transcripts | Key Inhibitor (Example) |
|---|---|---|---|---|
| RNA Polymerase I | Eukaryote | 14 subunits | rRNA (28S, 18S, 5.8S) | CX-5461 (in trials) |
| RNA Polymerase II | Eukaryote | 12 subunits | mRNA, snRNA, miRNA | α-Amanitin (toxin) |
| RNA Polymerase III | Eukaryote | 17 subunits | tRNA, 5S rRNA | ML-60218 (research) |
| RNA Polymerase | Bacteria | 5 subunits (α₂, β, β', ω) | All cellular RNAs | Rifampicin (antibiotic) |
The Translation Machinery: Ribosomes and Associated Factors
The ribosome is a ribonucleoprotein complex that catalyzes protein synthesis, decoding mRNA and assembling amino acids. It consists of a small (SSU) and large (LSU) subunit.
Key Components:
- rRNA: The catalytic and structural core (e.g., 18S in human SSU; 28S, 5.8S, 5S in LSU).
- Ribosomal Proteins (RPs): ~80 proteins that stabilize rRNA structure.
Regulatory Factors:
- eIFs (Eukaryotic Initiation Factors): Orchestrate 43S pre-initiation complex assembly, mRNA scanning, and start codon selection (e.g., eIF4F cap-binding complex).
- eEFs (Eukaryotic Elongation Factors): Facilitate aa-tRNA delivery (eEF1A) and ribosome translocation (eEF2).
- eRFs (Eukaryotic Release Factors): Terminate translation at stop codons.
Table 2: Key Quantitative Metrics of Human Cytosolic Ribosome
| Parameter | Value / Description | Method of Determination |
|---|---|---|
| Sedimentation Coefficient | 80S (40S + 60S subunits) | Analytical Ultracentrifugation |
| rRNA Length (Total) | ~7229 nucleotides (18S: 1869, 28S: 5070, 5.8S: 156, 5S: 121) | Sequencing |
| Number of Proteins | 80 (40S: 33, 60S: 47) | Mass Spectrometry |
| Peptidyl Transferase Rate | ~6 amino acids/sec (in vivo) | Kinetic Pulse-Chase Analysis |
Detailed Experimental Protocol: Co-Immunoprecipitation of Pol II Complexes
Objective: To identify proteins interacting with RNA Polymerase II under specific cellular conditions.
Methodology:
- Cell Lysis: Harvest 1x10^7 HEK293T cells. Lyse in 1 ml IP Lysis Buffer (25 mM Tris pH 7.4, 150 mM NaCl, 1% NP-40, 1 mM EDTA, protease/phosphatase inhibitors) on ice for 30 min. Centrifuge at 16,000 x g for 15 min at 4°C.
- Pre-Clearance: Incubate supernatant with 20 µl protein A/G magnetic beads for 1 hr at 4°C. Discard beads.
- Immunoprecipitation: Add 5 µg anti-RPB1 (phospho S2/S5) antibody or IgG isotype control to pre-cleared lysate. Incubate overnight at 4°C with rotation.
- Bead Capture: Add 50 µl pre-washed protein A/G beads. Incubate for 2 hrs at 4°C.
- Washing: Pellet beads and wash 5x with 1 ml ice-cold IP Lysis Buffer.
- Elution: Elute bound proteins with 40 µl 2X Laemmli buffer by heating at 95°C for 10 min.
- Analysis: Analyze by Western Blot (for known interactants) or by mass spectrometry (for discovery).
Visualizing the Central Dogma Pathway
Diagram Title: Central Dogma with Key Players and Regulation
The Scientist's Toolkit: Key Research Reagent Solutions
Table 3: Essential Reagents for Transcription/Translation Research
| Reagent / Kit | Supplier Examples | Function in Research |
|---|---|---|
| α-Amanitin | Sigma-Aldrich, Cayman Chemical | Specific, potent inhibitor of RNA Polymerase II; used to block transcription. |
| Triptolide | MedChemExpress, Tocris | Inhibits XPB subunit of TFIIH, blocking Pol II transcription initiation. |
| Harringtonine | Cell Signaling Technology | Inhibits translation elongation by blocking the large ribosomal subunit. |
| Poly(A) Polymerase | NEB, Thermo Fisher | Adds poly(A) tails to RNA in vitro; used in mRNA synthesis and tailing assays. |
| RiboPuromycin | Scilight Biotechnology | A puromycin analog that incorporates into nascent chains; used for ribosome puromycylation assays to visualize active translation sites. |
| TRAP (Translating Ribosome Affinity Purification) Kit | Takara Bio, Miltenyi Biotec | Isolates mRNA bound by ribosomes from specific cell types for translatome profiling. |
| Click-iT AHA / HPG | Thermo Fisher | Methionine analogs for bio-orthogonal labeling of newly synthesized proteins (pulse-chase). |
| mRNA Cap Analog (Anti-Reverse Cap Analog - ARCA) | Trilink Biotechnologies | Used in in vitro transcription to produce capped mRNAs with superior translational efficiency. |
| Pol II CTD (phospho-specific) Antibodies | Abcam, Cell Signaling Tech | Detect specific phosphorylation states (Ser2, Ser5, Ser7) of Pol II CTD to assess transcriptional stage. |
1. Introduction: Challenging the Central Dogma The canonical flow of genetic information—DNA → RNA → protein—remains a foundational principle. However, key biological phenomena necessitate its expansion. Reverse transcription, RNA editing, and prion-based inheritance represent critical exceptions that modify, bypass, or operate orthogonally to this linear pathway. This whitepaper details the mechanisms, experimental interrogation, and therapeutic implications of these processes, framed within a broader thesis on the complex, dynamic, and often recursive flow of biological information.
2. Mechanisms & Quantitative Data 2.1 Reverse Transcription Catalyzed by reverse transcriptase (RT), this process copies RNA into cDNA, facilitating retrotransposon mobility, telomere maintenance (in eukaryotes), and viral replication (e.g., HIV-1, HBV).
Table 1: Key Reverse Transcriptase Enzymes & Metrics
| Source | Processivity (nt/min) | Fidelity (Error Rate) | Primary Cellular Role |
|---|---|---|---|
| HIV-1 RT | 100-200 | ~1 in 10⁴ - 10⁵ | Viral replication |
| Telomerase (TERT) | ~50-100 | N/A | Telomere elongation |
| LINE-1 ORF2p | ~300-600 | ~1 in 10⁵ - 10⁶ | Retrotransposition |
| Moloney Murine Leukemia Virus (M-MLV) RT | 500-1000 | ~1 in 10⁵ | In vitro cDNA synthesis |
2.2 RNA Editing Post-transcriptional alteration of RNA sequences, primarily via Adenosine Deaminases Acting on RNA (ADARs) and Apolipoprotein B mRNA Editing Catalytic Polypeptide-like (APOBEC) enzymes.
Table 2: Major RNA Editing Types & Impact
| Editing Type | Enzyme Family | Substrate | Genomic Prevalence (Human) | Functional Consequence |
|---|---|---|---|---|
| A-to-I | ADAR1, ADAR2 | dsRNA | >100 million sites | miRNA processing, neural function, immune tolerance |
| C-to-U | APOBEC1 | mRNA (e.g., APOB) | Limited, targeted | Lipoprotein metabolism |
| 2.3 Prion Propagation |
Prions are misfolded, self-templating protein conformers that transmit information without nucleic acid changes. The mammalian prion protein (PrP) transitions from PrPC (cellular) to PrPSc (scrapie).
Table 3: Prion Strain Characteristics (Model Data)
| Strain | Incubation Period (days, mouse) | Neuropathology | PrPSc Stability (GdnHCl½) | Glycoform Ratio |
|---|---|---|---|---|
| RML | 150 ± 10 | Diffuse plaques | 2.2 M | Low diglycosylated |
| 301C | 80 ± 5 | Severe vacuolation | 1.8 M | High monoglycosylated |
| 22L | 130 ± 8 | Focal plaques | 2.5 M | High diglycosylated |
3. Experimental Protocols 3.1 Detecting Retrotransposition Events (LINE-1 Assay)
- Principle: A engineered LINE-1 element with a retrotransposition-activated reporter (e.g., mNeonGreen) is transfected into cells.
- Protocol:
- Construct: Clone a codon-optimized LINE-1 (ORF1p/ORF2p) into expression vector. Insert an intron in antisense orientation within the reporter cassette, which is in sense orientation relative to LINE-1.
- Transfection: Transfect HEK293T or HeLa cells using polyethylenimine (PEI).
- Culture: Maintain for 5-7 days to allow for transcription, splicing, reverse transcription, and genomic integration.
- Analysis: Quantify reporter-positive cells via flow cytometry. Confirm integration via PCR across intron-exon junctions and sequencing.
3.2 Quantifying A-to-I RNA Editing (Deep Sequencing Analysis)
- Principle: A-to-I editing creates I:U mismatches. Sequencing identifies A-to-G discrepancies between RNA and reference DNA.
- Protocol:
- Nucleic Acid Isolation: Extract total RNA and genomic DNA from same sample.
- Library Prep: Treat RNA with RNase R to enrich for mRNA. Prepare stranded RNA-seq and DNA-seq libraries.
- Sequencing: Perform ≥100bp paired-end sequencing on Illumina platform (≥50M reads for RNA).
- Bioinformatic Pipeline: Map RNA-seq reads (STAR). Call editing sites using REDItools2 or JACUSA2, requiring: a) A-to-G mismatch, b) coverage ≥10, c) editing level ≥1%, d) absence in matched DNA-seq.
3.3 Detecting Protease-Resistant PrPSc (Cell Assay)
- Principle: PrPSc is partially resistant to proteinase K (PK) digestion.
- Protocol:
- Lysate: Lyse prion-infected cells (e.g., ScN2a) or brain homogenate in lysis buffer (0.5% NP-40, 0.5% sodium deoxycholate).
- Digestion: Aliquot lysate. Treat one with PK (10-50 µg/mL, 37°C, 30 min). Use undigested aliquot as control.
- Detection: Terminate digestion with PMSF. Run samples on SDS-PAGE, transfer to membrane.
- Immunoblot: Probe with anti-PrP antibody (e.g., 6D11). PrPC degrades (~18-30 kDa signal lost); residual signal (~27-30 kDa) indicates PK-resistant PrPSc.
4. Visualization of Pathways & Workflows
Diagram 1: Expanded Central Dogma with Exceptions
Diagram 2: RNA Editing Site Detection Workflow
5. The Scientist's Toolkit: Key Research Reagents
Table 4: Essential Reagents for Studying Expanded Dogma Mechanisms
| Reagent / Material | Supplier Examples | Function in Research |
|---|---|---|
| High-Fidelity Reverse Transcriptases (SuperScript IV, PrimeScript) | Thermo Fisher, Takara | cDNA synthesis for low-abundance or structured RNA targets; high yield and fidelity. |
| LINE-1 Retrotransposition Reporter Construct | Addgene, custom synthesis | Engineered plasmid to quantify de novo retrotransposition events in cultured cells. |
| ADAR/APOBEC Expression Plasmids | Addgene, OriGene | Overexpression or knockout studies to define editing enzyme specificity and function. |
| Proteinase K | Roche, Sigma-Aldrich | Differential digestion to detect protease-resistant prion conformers (PrPSc) in immunoblots. |
| Anti-PrP Monoclonal Antibodies (6D11, 3F4) | BioLegend, MilliporeSigma | Specific detection of prion protein isoforms in ELISA, western blot, or immunohistochemistry. |
| Prion-Infected Cell Lines (ScN2a, SMB) | ATCC, research repositories | Model systems for studying prion propagation and screening anti-prion compounds. |
| Next-Generation Sequencing Kits (TruSeq, SMRTbell) | Illumina, PacBio | Comprehensive analysis of transcriptomes (RNA editing) and integration sites (retrotransposition). |
Within the central dogma's flow of biological information from DNA to RNA to protein, epigenetic regulation of chromatin architecture serves as the fundamental gatekeeper. This whitepaper examines the mechanisms by which nucleosome positioning, histone modifications, and 3D genome organization dynamically control the accessibility of genetic information, thereby precisely regulating transcriptional output. This regulation is critical for cellular differentiation, response to stimuli, and disease etiology, presenting prime targets for therapeutic intervention.
The DNA sequence is a static code, but its interpretation is dynamically regulated by its packaging into chromatin. The nucleosome, comprising ~147 bp of DNA wrapped around an octamer of core histones (H2A, H2B, H3, H4), forms the primary repeating unit. The density and positioning of nucleosomes, along with post-translational modifications (PTMs) of histones and the action of chromatin remodelers, create a landscape that either permits or obstructs the transcription machinery. Higher-order folding into topologically associating domains (TADs) and compartments further orchestrates long-range enhancer-promoter interactions. This architecture directly dictates the efficiency and specificity of transcription, the first critical step in biological information flow.
Core Mechanisms of Architectural Control
Nucleosome Positioning and Remodeling
ATP-dependent chromatin remodeling complexes (e.g., SWI/SNF, ISWI, CHD, INO80 families) slide, evict, or restructure nucleosomes to control DNA accessibility.
Table 1: Major Chromatin Remodeling Complex Families
| Complex Family | Core ATPase | Primary Function | Impact on Information Flow |
|---|---|---|---|
| SWI/SNF | BRG1/BRM | Slides/evicts nucleosomes, creates accessible sites. | Activates transcription. |
| ISWI | SMARCA5 (SNF2H) | Slides nucleosomes to regular spacing. | Represses or fine-tunes access. |
| CHD | CHD1, CHD4 | Slides/evicts nucleosomes, binds modified histones. | Activation (CHD1) or repression (NuRD). |
| INO80 | INO80 | Exchanges histone variants (e.g., H2A.Z). | Facilitates dynamic transcriptional responses. |
Histone Modifications and the Histone Code
Covalent PTMs on histone tails (e.g., acetylation, methylation, phosphorylation) create binding platforms for effector proteins and alter chromatin fiber compactness.
Table 2: Key Histone Modifications and Their Functional Output
| Modification | Typical Residue | Writer Enzyme | Eraser Enzyme | Reader Domain | Transcriptional Effect |
|---|---|---|---|---|---|
| H3K4me3 | H3 Lysine 4 | SET1/COMPASS | KDM5 family | PHD finger | Strongly associated with active promoters. |
| H3K27ac | H3 Lysine 27 | p300/CBP | HDAC1/2/3 | Bromodomain | Marks active enhancers and promoters. |
| H3K36me3 | H3 Lysine 36 | SETD2 | KDM2/4 | - | Associated with transcriptional elongation. |
| H3K9me3 | H3 Lysine 9 | SUV39H | KDM4 family | Chromodomain | Facultative heterochromatin, repression. |
| H3K27me3 | H3 Lysine 27 | EZH2 (PRC2) | KDM6A (UTX) | CBX (in PRC1) | Constitutive heterochromatin, silencing. |
3D Genome Organization
Chromosome Conformation Capture (Hi-C) technologies have revealed that the genome is organized into hierarchical structures that facilitate or inhibit regulatory interactions.
Table 3: Levels of 3D Genome Organization
| Level | Scale | Key Features | Role in Information Flow |
|---|---|---|---|
| Compartments | Megabases | A (active, gene-rich) and B (inactive, gene-poor) compartments. | Segregates active and inactive chromatin. |
| Topologically Associating Domains (TADs) | ~100kb - 1Mb | Self-interacting regions bounded by CTCF/cohesin. | Insulates enhancer-promoter interactions. |
| Chromatin Loops | ~10kb - 1Mb | Direct, often CTCF/cohesin-mediated, contacts. | Brings distal enhancers to target promoters. |
Experimental Protocols for Chromatin Architecture Analysis
Assay for Transposase-Accessible Chromatin with high-throughput sequencing (ATAC-seq)
Purpose: To map genome-wide chromatin accessibility. Detailed Protocol:
- Cell Lysis & Transposition: Isolate 50,000-100,000 viable nuclei. Resuspend nuclei in a transposition reaction mix containing the Tn5 transposase (loaded with sequencing adapters). Incubate at 37°C for 30 minutes.
- DNA Purification: Clean up the transposed DNA using a silica membrane-based purification kit.
- PCR Amplification & Library Preparation: Amplify the purified DNA with 10-12 cycles of PCR using barcoded primers.
- Sequencing & Analysis: Perform paired-end sequencing on an Illumina platform. Align reads to the reference genome and call peaks of accessibility using tools like MACS2.
Chromatin Immunoprecipitation followed by sequencing (ChIP-seq)
Purpose: To map the genomic localization of specific histone modifications or chromatin-associated proteins. Detailed Protocol:
- Crosslinking & Sonication: Crosslink proteins to DNA with 1% formaldehyde for 10 min. Quench with glycine. Lyse cells and shear chromatin to 200-500 bp fragments via sonication.
- Immunoprecipitation: Incubate sheared chromatin with a validated, specific antibody against the target (e.g., anti-H3K27ac) overnight at 4°C. Capture antibody-chromatin complexes with protein A/G magnetic beads.
- Washing, Elution & Reverse Crosslinking: Wash beads stringently. Elute complexes and reverse crosslinks by incubating at 65°C with high salt.
- DNA Purification & Library Prep: Purify DNA and prepare a sequencing library for Illumina platforms.
- Analysis: Align reads, call peaks, and visualize on a genome browser.
High-throughput Chromosome Conformation Capture (Hi-C)
Purpose: To map 3D chromatin interactions genome-wide. Detailed Protocol:
- Crosslinking & Digestion: Crosslink cells with formaldehyde. Lyse cells and digest DNA with a restriction enzyme (e.g., MboI or DpnII).
- Proximity Ligation: Mark digested ends with biotin and perform a ligation under dilute conditions to favor intra-molecular ligation of crosslinked fragments.
- Reverse Crosslinking & Purification: Reverse crosslinks, purify DNA, and shear. Capture biotin-labeled ligation junctions with streptavidin beads.
- Library Preparation & Sequencing: Prepare a sequencing library from the captured DNA. Perform paired-end sequencing.
- Data Processing: Use pipelines (e.g., HiC-Pro, Juicer) to filter, map reads, and generate contact matrices. Identify TADs and loops with tools like Arrowhead and HiCCUPS.
Visualizing Chromatin Regulation Pathways and Workflows
Diagram Title: Chromatin Gates DNA Access for Transcription
Diagram Title: CTCF/Cohesin Mediated Loop Formation
Diagram Title: Chromatin Architecture Analysis Workflow
The Scientist's Toolkit: Key Research Reagent Solutions
Table 4: Essential Reagents for Chromatin Architecture Studies
| Reagent/Material | Vendor Examples (Illustrative) | Function in Research |
|---|---|---|
| Validated ChIP-seq Grade Antibodies | Cell Signaling Tech, Active Motif, Abcam | Specific immunoprecipitation of histone PTMs or chromatin proteins for mapping. |
| Hyperactive Tn5 Transposase | Illumina (Nextera), Diagenode | Enzyme for simultaneous fragmentation and tagging in ATAC-seq and related methods. |
| Protein A/G Magnetic Beads | Thermo Fisher, MilliporeSigma | Efficient capture of antibody-bound chromatin complexes for ChIP. |
| CTCF/Cohesin Inhibitors (e.g., Auxin-inducible degron systems) | N/A (Genetic tools) | Tools for acute depletion to study dynamic 3D genome reorganization. |
| HDAC and BET Bromodomain Inhibitors | Cayman Chemical, Selleckchem | Chemical probes to perturb histone acetylation states and readout. |
| Next-Generation Sequencing Kits | Illumina, PacBio | For generating high-throughput sequencing libraries from low-input chromatin-derived DNA. |
| Bioinformatics Pipelines & Software | ENCODE Consortium pipelines, HiC-Pro, Juicebox, WashU EpiGenome Browser | Critical for processing, analyzing, and visualizing complex chromatin data. |
Chromatin architecture is not a passive scaffold but an active, dynamic regulator that dictates the precision, timing, and magnitude of biological information flow. Dysregulation of epigenetic mechanisms is a hallmark of cancer, neurodevelopmental disorders, and aging. The experimental toolkit outlined here enables researchers to decode this layer of regulation. In drug development, targeting chromatin regulators—such as EZH2 (H3K27 methyltransferase), BET bromodomain readers, or HDACs—has proven viable. Future therapies will increasingly aim to correct pathological chromatin states, thereby restoring normal information flow from gene to function.
The central dogma of molecular biology, describing the flow of information from DNA to RNA to protein, has long provided the foundational framework for biological research. However, the discovery of vast transcriptional outputs that do not encode proteins has dramatically expanded this paradigm. Non-coding RNAs (ncRNAs) represent a critical layer of regulatory information, modulating gene expression and cellular function at every level, from chromatin architecture to protein translation and stability. This whitepaper provides an in-depth technical overview of the major classes of ncRNAs, their mechanisms of action, experimental methodologies for their study, and their implications for therapeutic development.
Classification and Functions of Major ncRNA Classes
Non-coding RNAs are broadly categorized by size and function. The table below summarizes the key classes, their characteristics, and primary roles.
Table 1: Major Classes of Non-Coding RNAs
| Class | Size (nt) | Primary Function | Example | Mechanistic Role |
|---|---|---|---|---|
| MicroRNA (miRNA) | 20-22 | Post-transcriptional gene silencing | let-7, miR-21 | Binds to 3'UTR of target mRNAs, leading to translational repression or mRNA degradation. |
| Long Non-Coding RNA (lncRNA) | >200 | Diverse transcriptional & epigenetic regulation | XIST, MALAT1, HOTAIR | Scaffold for protein complexes, guide for chromatin modifiers, molecular decoy, enhancer RNA. |
| Piwi-interacting RNA (piRNA) | 26-31 | Transposon silencing in germline | Various | Forms complex with Piwi proteins, guides transcriptional and post-transcriptional transposon silencing. |
| Small Interfering RNA (siRNA) | 20-25 | Exogenous defense, viral silencing | Synthetic dsRNA | Perfect complementarity triggers Argonaute2-mediated cleavage of target RNA (RNA interference). |
| Circular RNA (circRNA) | Variable | miRNA sponge, protein decoy, translation | CDR1as | Acts as competitive endogenous RNA (ceRNA), sequestering miRNAs; some can be translated. |
Mechanistic Insights: Pathways of ncRNA Action
miRNA Biogenesis and Mode of Action
MicroRNAs are transcribed as primary transcripts (pri-miRNAs), processed in the nucleus by Drosha to pre-miRNAs, exported, and finally diced by Dicer in the cytoplasm to mature miRNAs. The mature miRNA is loaded into the RNA-induced silencing complex (RISC), where it guides target recognition.
Diagram 1: miRNA Biogenesis and Function Pathway
lncRNA-Mediated Epigenetic Silencing
LncRNAs like XIST and HOTAIR recruit chromatin-modifying complexes to specific genomic loci, establishing repressive chromatin states (heterochromatin).
Diagram 2: lncRNA Guides Chromatin Modification
Experimental Protocols for ncRNA Research
Protocol: CLIP-seq for Identifying RNA-Protein Interactions
Aim: To map the precise binding sites of an RNA-binding protein (e.g., Argonaute for miRNAs) on its target RNAs.
- Crosslinking: Cells are irradiated with UV-C (254 nm) to create covalent bonds between proteins and bound RNAs.
- Cell Lysis & Immunoprecipitation: Lysates are treated with RNase I to partially digest unbound RNA, leaving protected footprints. The protein of interest is immunoprecipitated with a specific antibody.
- RNA Processing: Proteins are digested with proteinase K. Co-immunoprecipitated RNA is extracted, reverse-transcribed, and converted into a sequencing library.
- Sequencing & Analysis: High-throughput sequencing identifies RNA sequences bound by the protein. Peak calling algorithms define binding sites.
Protocol: CRISPRi for Functional lncRNA Knockdown
Aim: To specifically repress the transcription of a lncRNA locus without altering the DNA sequence.
- Design: Design a single guide RNA (sgRNA) targeting the promoter or transcriptional start site of the target lncRNA.
- Delivery: Co-transfect cells with plasmids expressing the sgRNA and a catalytically dead Cas9 (dCas9) fused to a transcriptional repressor domain (e.g., KRAB).
- Formation of Repressive Complex: The dCas9-KRAB-sgRNA complex binds to the target DNA site, locally recruiting chromatin modifiers that establish a repressive state.
- Validation: Measure lncRNA expression via RT-qPCR and assess phenotypic consequences.
The Scientist's Toolkit: Key Research Reagent Solutions
Table 2: Essential Reagents for ncRNA Research
| Reagent / Tool | Function | Application Example |
|---|---|---|
| Locked Nucleic Acid (LNA) Gapmers | Chemically modified antisense oligonucleotides with high binding affinity and nuclease resistance. | Potent and specific knockdown of nuclear lncRNAs or pre-miRNAs. |
| miRNA Mimics & Inhibitors | Synthetic double-stranded RNAs mimicking mature miRNAs or single-stranded antisense molecules for inhibition. | Gain-of-function and loss-of-function studies for specific miRNAs. |
| Drosha/Dicer siRNA Pools | siRNA libraries targeting core RNAi machinery components. | Global inhibition of canonical miRNA biogenesis pathways. |
| MS2 / Cas13 tethering systems | Systems to artificially recruit proteins or modifiers to specific RNA sequences (MS2 stem-loops) or to degrade RNA (Cas13). | Study the function of an RNA in situ or achieve targeted RNA degradation. |
| RNase R | 3'->5' exoribonuclease that degrades linear RNAs but not circular RNAs. | Enrichment of circRNAs from total RNA samples for sequencing or analysis. |
| Crosslinking Reagents (Formaldehyde, AMT) | Induce protein-RNA or RNA-RNA crosslinks for interaction studies. | Required for protocols like CLIP-seq, PAR-CLIP, and SHAPE-MaP. |
Therapeutic Implications and Quantitative Landscape
The dysregulation of ncRNAs is a hallmark of many diseases, making them attractive therapeutic targets and biomarkers.
Table 3: ncRNAs in Drug Development: Clinical Pipeline Snapshot
| Therapeutic Modality | Target ncRNA / Disease | Development Phase | Mechanism |
|---|---|---|---|
| Antisense Oligonucleotide (ASO) | miR-122 (Hepatitis C) | Approved (Miravirsen) | Sequesters miR-122, destabilizing viral RNA. |
| LNA AntimiR | miR-155 (Cutaneous T-cell Lymphoma) | Phase II | Inhibits oncogenic miR-155. |
| siRNA (GalNAc-conjugated) | TTR mRNA (Amyloidosis) | Approved (Patisiran) | Although targeting mRNA, platform is applicable to ncRNAs. |
| Small Molecule Inhibitor | MALAT1 (Metastasis) | Preclinical | Binds lncRNA structure, disrupts function. |
| CRISPRa | UBE3A-AS (Angelman Syndrome) | Preclinical | Activates paternal UBE3A by repressing antisense lncRNA. |
In conclusion, non-coding RNAs are integral components of the information flow from DNA to protein, forming dense regulatory networks that fine-tune gene expression. Their study requires specialized tools and methodologies, as outlined here. For drug development professionals, ncRNAs offer a promising new frontier of "druggable" targets with the potential for high specificity, moving beyond the traditional protein-centric paradigm.
The unidirectional flow of genetic information—from DNA to RNA to protein—forms the core principle of molecular biology. However, this linear model fails to capture the intricate spatial and temporal regulation that defines cellular function. This whitepaper focuses on spatiotemporal dynamics, specifically the mechanisms of compartmentalization and local translation, which are critical post-transcriptional regulatory layers. These processes ensure the precise subcellular localization and on-demand synthesis of proteins, enabling rapid cellular responses, maintaining polarity, and establishing complex cellular architectures. For researchers and drug developers, understanding these dynamics opens avenues for targeting mislocalized proteins or dysregulated local translation in diseases such as neurodegeneration, cancer, and metabolic disorders.
Core Mechanisms and Quantitative Insights
Compartmentalization of mRNA
mRNAs are sorted to specific subcellular locations via cis-acting elements in their sequences (often in the 3' UTR) and trans-acting RNA-binding proteins (RBPs). This targeting is energy-dependent and frequently involves the cytoskeleton.
Table 1: Key mRNA Localization Systems and Their Dynamics
| System/Cell Type | Localized mRNA | Targeting cis-Element (Zipcode) | Key RBP(s) | Average Transport Velocity | Key Function |
|---|---|---|---|---|---|
| Fibroblast/Migrating Cell | β-actin | 54-nt "Zipcode" | ZBP1 | 1-2 µm/sec | Leading edge protrusion, cell motility |
| Neuron - Axon/Dendrite | CaMKIIα, β-actin, Arc | Various dendritic targeting elements | FMRP, CPEB, Staufen | 0.1-0.5 µm/sec (active transport) | Synaptic plasticity, learning & memory |
| Oocyte (Drosophila) | oskar, bicoid | Multiple 3' UTR sequences | Staufen, Swallow | ~0.1 µm/sec (microtubule-dependent) | Body axis specification, development |
| Oligodendrocyte | MBP (Myelin Basic Protein) | A2RE sequence | hnRNP A2 | Not quantified | Myelin sheath formation |
Machinery and Regulation of Local Translation
Local translation requires the co-localization of translation machinery (ribosomes, tRNAs, initiation factors) with the targeted mRNA. Translation is often repressed during transport and activated at the destination by specific signaling events.
Table 2: Quantitative Parameters of Local Translation Events
| Parameter | Neuronal Synapse (Dendrite) | Axonal Growth Cone | Cellular Pseudopodium | Primary Reference |
|---|---|---|---|---|
| Typical Delay from Stimulus to Protein Synthesis | 2-5 minutes | 1-3 minutes | 3-10 minutes | Buxbaum et al., Science (2014) |
| Estimated Ribosomes per Local Site | 1-3 polyribosomes | 2-5 polyribosomes | Data limited; likely 1-2 | Holt et al., Neuron (2019) |
| Key Initiating Signaling Pathways | mGluR1/5 → MAPK; NMDAR → CaMKII | NGF/TrkA → PI3K/mTOR | PDGF/FGF → PI3K/Src | Yoon et al., Cell (2016) |
| Common Readout Method | FUNCAT (FUNctional non-CAnonical amino acid Tagging), smFISH/IF | puromycylation, SunTag live imaging | TRICK (Translating RNA Imaging by Coat protein Knock-off) | Wu et al., Nature Methods (2016) |
Experimental Protocols for Key Methodologies
Protocol: Single-Molecule Fluorescence In Situ Hybridization (smFISH) for mRNA Localization
Objective: To visualize and quantify the subcellular location and copy number of individual mRNA molecules. Materials: Fixed cells, target-specific smFISH probe sets (e.g., Stellaris), hybridization buffer, wash buffer, mounting medium with DAPI. Procedure:
- Fixation & Permeabilization: Fix cells with 4% paraformaldehyde (PFA) for 10 min at room temperature (RT). Permeabilize with 70% ethanol at 4°C for 1 hour or 0.1% Triton X-100 for 5 min.
- Hybridization: Resuspend lyophilized DNA oligonucleotide probes (each ~20 nt, labeled with a fluorophore like Quasar 670) in hybridization buffer. Apply probe solution to fixed cells and incubate in a dark, humidified chamber at 37°C overnight.
- Washing: Remove probe solution and wash cells twice with wash buffer (containing formamide and SSC) at 37°C for 30 min each.
- Counterstaining & Imaging: Stain nuclei with DAPI (1 µg/mL) for 5 min. Mount slides and image using a widefield or confocal microscope with a 60x or 100x oil-immersion objective.
- Analysis: Use automated spot-detection software (e.g., FISH-quant, Big-FISH) to identify and count individual mRNA puncta within defined cellular compartments.
Protocol: Proximity-specific Ribosome Profiling (APEX-Ribo)
Objective: To map the complete translatome of a specific organelle or subcellular compartment. Materials: Cell line expressing APEX2 fusion protein targeted to compartment of interest (e.g., APEX2-OMP25 for outer mitochondrial membrane), biotin-phenol, H₂O₂, streptavidin beads, reagents for RNA-seq library prep. Procedure:
- Biotinylation: Induce expression of APEX2 fusion. Treat cells with 500 µM biotin-phenol for 30 min. Initiate proximity-dependent biotinylation by adding 1 mM H₂O₂ for exactly 1 minute. Quench with Trolox and sodium ascorbate.
- Harvesting & Lysis: Lyse cells in polysome-preserving buffer (e.g., with cycloheximide).
- Affinity Purification: Incubate lysate with streptavidin-coated magnetic beads to capture biotinylated ribosomes and their associated mRNAs.
- RNA Extraction & Sequencing: Extract RNA from the bead-bound fraction. Generate and sequence ribosome-protected mRNA footprints (RPFs) via standard Ribo-seq protocols. Perform parallel total RNA-seq from the same compartment.
- Bioinformatics: Align RPFs to the transcriptome. Compartment-specific translation is identified by enrichment of RPFs in the APEX-purified sample versus total cellular lysate or a cytosolic control.
Visualization of Pathways and Workflows
Diagram 1: Synaptic stimulus triggers translation via CPEB.
Diagram 2: APEX-Ribo-seq maps organelle-specific translation.
The Scientist's Toolkit: Research Reagent Solutions
Table 3: Essential Reagents and Tools for Studying Local Translation
| Item/Reagent | Function/Application | Example Product/Technique |
|---|---|---|
| smFISH Probe Sets | Label individual mRNA molecules with multiple short, fluorescent oligonucleotides for high-sensitivity, single-molecule detection. | Stellaris RNA FISH probes (LGC Biosearch), RNAscope (ACD). |
| Photoactivatable/Photoswitchable Reporters | Visualize de novo protein synthesis in live cells with spatiotemporal control. | pSUN-CFP (SunTag system), FUNCAT with photoactivatable non-canonical amino acids. |
| TRICK (Translating RNA Imaging) | Distinguish between translating and non-translating mRNA molecules in real-time. | MS2/MCP and PP7/PCP stem-loop systems with distinct fluorophores. |
| APEX2/HRP Proximity Labeling Enzymes | For proteomic or RNA profiling of specific organelles/compartments. | APEX2, miniTurbo. Used in APEX-Ribo-seq, APEX-Seq. |
| Ribosome Profiling (Ribo-seq) Kits | Isolate and sequence ribosome-protected mRNA fragments to map global translation. | ARTseq/TruSeq Ribo Profile kits (Illumina). |
| Inhibitors of Translational Regulators | Chemically perturb specific nodes of translation initiation/elongation. | ISRIB (integrated stress response inhibitor), 4EGI-1 (eIF4E/eIF4G interaction), Harringtonine (initiation inhibitor). |
| Microfluidic Chambers | Isolate and manipulate subcellular compartments (e.g., axons) for compartment-specific omics. | Campenot chambers, microfluidic axon isolation devices. |
| Subcellular Fractionation Kits | Biochemically isolate specific organelles (polysomes, mitochondria, ER). | Sucrose gradient media for polysome profiling, mitochondrial isolation kits (e.g., from Thermo Fisher). |
Tools of the Trade: Advanced Techniques for Quantifying and Manipulating Gene Expression
This technical guide details three pivotal high-throughput sequencing methodologies—RNA-seq, ATAC-seq, and Ribosome Profiling—for dissecting the flow of genetic information from DNA to RNA to protein. By quantifying transcriptional output, chromatin accessibility, and translational activity, these techniques provide a multi-layered view of gene regulation, which is fundamental for advancing molecular biology research and therapeutic discovery.
The central dogma of molecular biology outlines the sequential flow of information from DNA to RNA to protein. Modern functional genomics employs high-throughput sequencing to quantify each stage. RNA-seq captures the transcriptome, ATAC-seq probes the regulatory genome by identifying accessible chromatin, and Ribosome Profiling (Ribo-seq) maps active protein synthesis. Together, they form a comprehensive toolkit for researchers and drug developers to understand gene expression regulation, identify dysregulated pathways in disease, and discover novel therapeutic targets.
RNA-seq: Comprehensive Transcriptome Analysis
RNA sequencing (RNA-seq) provides a quantitative snapshot of the cellular transcriptome, revealing the identity, abundance, and structure of RNA molecules.
Core Methodology
- RNA Isolation & Quality Control: Total RNA is extracted, followed by enrichment for polyadenylated mRNA or depletion of ribosomal RNA. RNA Integrity Number (RIN) > 8.0 is typically required.
- Library Preparation: RNA is fragmented, reverse-transcribed into double-stranded cDNA, and sequencing adapters are ligated. Strand-specific protocols preserve orientation information.
- High-Throughput Sequencing: Libraries are sequenced on platforms such as Illumina NovaSeq, generating millions of short (75-150 bp) paired-end reads.
- Bioinformatic Analysis: Reads are aligned to a reference genome (e.g., using STAR or HISAT2). Quantification is performed at the gene or transcript level (e.g., using featureCounts, Salmon). Differential expression analysis uses statistical models (e.g., DESeq2, edgeR).
Key Applications & Data Output
RNA-seq identifies differentially expressed genes (DEGs), discovers novel isoforms and fusion transcripts, and quantifies alternative splicing events (measured by Percent Spliced In, PSI).
Table 1: Typical RNA-seq Output Metrics and Their Interpretation
| Metric | Typical Value/Range | Biological Interpretation |
|---|---|---|
| Total Reads | 20-50 million per sample | Sequencing depth; affects detection sensitivity. |
| Alignment Rate | > 70-90% | Proportion of reads mapping to the reference. |
| Number of DEGs | Varies by experiment (e.g., 100-5000) | Magnitude of transcriptomic response to a condition. |
| False Discovery Rate (FDR) | < 0.05 | Statistical confidence in identified DEGs. |
ATAC-seq: Mapping Chromatin Accessibility
Assay for Transposase-Accessible Chromatin with sequencing (ATAC-seq) identifies genome-wide regions of open chromatin, which typically correspond to regulatory elements like promoters and enhancers.
Core Methodology
- Cell Preparation & Permeabilization: Nuclei are isolated from fresh cells (50,000-100,000 is optimal). The use of frozen tissue can reduce data quality.
- Tagmentation: The hyperactive Tn5 transposase simultaneously fragments accessible DNA and inserts sequencing adapters.
- PCR Amplification & Library Purification: Tagmented DNA is amplified with a limited number of PCR cycles (typically 5-12) and purified.
- Sequencing & Analysis: Libraries are sequenced, often with paired-end reads. Peaks are called (e.g., using MACS2) to identify accessible regions, which are then annotated and linked to genes.
Key Applications & Data Output
ATAC-seq maps transcription factor binding sites, defines chromatin states, and infers regulatory networks by integrating with RNA-seq data.
Table 2: Typical ATAC-seq Output Metrics and Their Interpretation
| Metric | Typical Value/Range | Biological Interpretation |
|---|---|---|
| Fragment Size Distribution | Periodicity ~200 bp | Nucleosome positioning pattern. |
| Peak Number | 50,000 - 150,000 per sample | Total inferred regulatory regions. |
| Peaks in Promoters | ~20-30% of total | Proportion of accessible regions near gene starts. |
| Sequencing Depth | > 50 million reads (vertebrates) | Saturation for peak calling. |
Ribosome Profiling: Quantifying Translation
Ribosome Profiling (Ribo-seq) provides a genome-wide, codon-resolution snapshot of active translation by sequencing ribosome-protected mRNA fragments (RPFs).
Core Methodology
- Cell Harvest & Lysis: Cells are rapidly lysed using cycloheximide to arrest ribosomes.
- Nuclease Digestion: RNA is digested with RNase I, leaving only ~28-30 nucleotide fragments protected by ribosomes.
- Monosome Purification: Ribosome complexes are purified via size-exclusion chromatography or sucrose cushion centrifugation.
- RPF Isolation & Library Prep: RPFs are extracted, size-selected, and converted into a sequencing library. A parallel RNA-seq library controls for mRNA abundance.
- Analysis: RPFs are aligned, and their periodic positioning (3-nt periodicity) confirms translation. Translation efficiency is calculated as RPKM(Ribo-seq) / RPKM(RNA-seq).
Key Applications & Data Output
Ribo-seq quantifies translation rates, discovers novel microproteins and upstream open reading frames (uORFs), and identifies precise translational pausing sites.
Table 3: Typical Ribosome Profiling Output Metrics and Their Interpretation
| Metric | Typical Value/Range | Biological Interpretation |
|---|---|---|
| RPF Length | 28-30 nucleotides | Confirms ribosome protection. |
| Periodicity Score | High (e.g., > 0.8) | Confirms reads derive from translating ribosomes. |
| Translation Efficiency | Varies per gene (log2 scale) | Protein output independent of mRNA level. |
| uORF Identification | Thousands per genome | Potential regulatory elements in 5' UTRs. |
The Scientist's Toolkit: Essential Research Reagents
Table 4: Key Reagent Solutions for High-Throughput Sequencing Workflows
| Reagent / Kit | Function | Key Considerations |
|---|---|---|
| Poly(A) Selection Beads | Enriches for eukaryotic mRNA by binding poly-A tails. | Reduces ribosomal RNA background; not suitable for non-polyadenylated RNA. |
| RNase Inhibitors | Protects RNA from degradation during isolation and library prep. | Critical for maintaining RNA integrity, especially for long transcripts. |
| Tn5 Transposase (Tagmentase) | Engineered enzyme for simultaneous fragmentation and adapter tagging in ATAC-seq. | Activity lot-to-lot variation must be calibrated; commercial kits ensure reproducibility. |
| Cycloheximide | Translation inhibitor that arrests ribosomes on mRNA for Ribo-seq. | Must be used at consistent concentrations and exposure times for reproducible arrest. |
| RNase I | Nuclease that digests RNA not protected by ribosomes. | Requires precise digestion optimization to yield ~28-30 nt RPFs. |
| Size Selection Beads | Paramagnetic beads for precise nucleic acid fragment selection. | Critical for isolating RPFs and removing adapter dimers in all library preps. |
| Unique Dual Indexes | Barcodes for multiplexing samples in a single sequencing run. | Essential for reducing index hopping and sample cross-talk in NovaSeq runs. |
Integrated Analysis: A Multi-Omics View of Gene Regulation
The true power of these techniques is realized through integration, constructing a causal chain from regulatory element (ATAC-seq) to transcript (RNA-seq) to protein synthesis (Ribo-seq).
Workflow: Accessible chromatin peaks from ATAC-seq are overlapped with transcription factor motifs and linked to promoter regions of genes showing differential expression in RNA-seq. Changes in translation efficiency from Ribo-seq can then distinguish between purely transcriptional and post-transcriptional regulatory events.
RNA-seq, ATAC-seq, and Ribosome Profiling are indispensable, complementary tools for deconstructing the flow of biological information. Their integrated application provides an unprecedented, multi-dimensional view of gene regulation, driving discoveries in basic molecular mechanisms and accelerating the identification of novel drug targets and biomarkers in human disease.
The flow of biological information from DNA to RNA to protein is governed by complex regulatory mechanisms. Quantifying gene expression at the RNA level is a critical pillar for understanding this flow, enabling researchers to decipher transcriptional regulation, splicing variants, and non-coding RNA functions. Accurate RNA quantification directly informs hypotheses about subsequent protein synthesis and cellular phenotype. This guide provides a technical deep-dive into three cornerstone quantitative methods: quantitative real-time PCR (qPCR), droplet digital PCR (ddPCR), and emerging digital RNA counting techniques, framing their application within modern molecular biology research and therapeutic development.
Core Technologies: Principles and Comparison
Quantitative Real-Time PCR (qPCR)
qPCR monitors the amplification of a target cDNA sequence in real-time using fluorescent reporters. The cycle threshold (Ct), where fluorescence crosses a defined threshold, is inversely proportional to the starting template amount. Absolute quantification uses a standard curve, while relative quantification (e.g., ΔΔCt method) compares expression to a reference gene.
Droplet Digital PCR (ddPCR)
ddPCR partitions a PCR reaction into thousands of nanoliter-sized droplets. Following endpoint PCR, each droplet is analyzed for fluorescence. The fraction of positive droplets is used in a Poisson statistical model to provide an absolute count of target molecules without a standard curve, offering high precision for low-abundance targets and rare variants.
Digital RNA Counting (e.g., Single-Molecule RNA FISH, High-Throughput Sequencing)
These methods enable direct visualization or enumeration of individual RNA molecules within cells or from a sample. Techniques like single-molecule Fluorescence In Situ Hybridization (smFISH) use multiple fluorescent probes per transcript for spatial quantification. Digital barcoding strategies coupled with NGS (e.g., from 10x Genomics) allow for counting of millions of individual RNA molecules across entire transcriptomes.
Table 1: Comparative Analysis of RNA Quantification Methods
| Feature | qPCR | ddPCR | Digital RNA Counting (smFISH example) |
|---|---|---|---|
| Measurement Principle | Kinetic fluorescence during PCR | Poisson statistics of endpoint positive droplets | Direct microscopic visualization of single molecules |
| Quantification Output | Relative (Ct) or Absolute (from std curve) | Absolute copy number/μL | Absolute copy number per cell |
| Dynamic Range | ~7-8 orders of magnitude | ~5 orders of magnitude | ~3-4 orders of magnitude per probe set |
| Precision & Sensitivity | High sensitivity; precision depends on replicates/reference | Excellent precision, ideal for <5-fold changes & rare variants (<1%) | Single-molecule sensitivity; spatial context |
| Throughput | High (96-, 384-well plates) | Medium (up to 96 samples/run) | Low throughput per experiment (typically 10s of cells/ FOV) |
| Key Advantage | Established, high-throughput, relatively low cost | Absolute quantification, resistant to PCR inhibitors, no standard curve needed | Single-molecule resolution, spatial information in fixed cells |
| Primary Limitation | Requires stable reference genes for relative quant; inhibitor sensitive | Limited multiplexing (typically 2-plex), higher cost per sample than qPCR | Low multiplexing without specialized imaging, requires fixed samples |
Detailed Experimental Protocols
Protocol: Two-Step Reverse Transcription qPCR for Relative Gene Expression
A. RNA Isolation & QC:
- Extract total RNA using a column-based or phenol-chloroform method. Treat with DNase I.
- Quantify RNA using a spectrophotometer (NanoDrop) or fluorometer (Qubit). Assess integrity via Agilent Bioanalyzer (RIN >8.0 recommended).
B. Reverse Transcription:
- In a nuclease-free tube, combine: 1 μg total RNA, 1 μL dNTP Mix (10 mM each), 1 μL Oligo(dT)18 primer (50 μM), and RNase-free water to 12 μL.
- Heat to 65°C for 5 min, then place on ice.
- Add: 4 μL 5x Reaction Buffer, 1 μL RiboLock RNase Inhibitor (20 U/μL), 2 μL 0.1 M DTT, and 1 μL RevertAid Reverse Transcriptase (200 U/μL). Mix gently.
- Incubate: 42°C for 60 min, followed by 70°C for 5 min to terminate. Dilute cDNA 1:5 with nuclease-free water.
C. qPCR Amplification:
- Prepare reaction mix per well (20 μL total): 10 μL 2x SYBR Green Master Mix, 1 μL Forward Primer (10 μM), 1 μL Reverse Primer (10 μM), 3 μL nuclease-free water, 5 μL diluted cDNA.
- Run in triplicate on a real-time PCR instrument. Cycling: 95°C for 10 min (initial denaturation); 40 cycles of [95°C for 15 sec, 60°C for 60 sec]; followed by a melt curve analysis.
- Analyze using the ΔΔCt method. Normalize target gene Ct values to the geometric mean of 2-3 validated reference genes.
Protocol: ddPCR for Absolute miRNA Quantification
A. Reverse Transcription for miRNA:
- Use a stem-loop RT primer specific to the target miRNA. Combine: 1-10 ng total RNA, 1 μL stem-loop RT primer (5 μM), dNTPs, buffer, reverse transcriptase. Follow manufacturer’s specific protocol (e.g., from TaqMan MicroRNA Assay).
B. Droplet Generation & PCR:
- Prepare ddPCR reaction: 11 μL 2x ddPCR Supermix for Probes (no dUTP), 1.1 μL 20x TaqMan Assay (FAM-labeled), 5.9 μL nuclease-free water, 4 μL RT product.
- Load mixture into a DG8 cartridge alongside 70 μL of Droplet Generation Oil. Generate droplets using a QX200 Droplet Generator.
- Transfer 40 μL of emulsified sample to a 96-well PCR plate. Seal and run PCR: 95°C for 10 min; 40 cycles of [94°C for 30 sec, 60°C for 60 sec]; 98°C for 10 min (ramp rate: 2°C/sec).
C. Droplet Reading & Analysis:
- Load plate into a QX200 Droplet Reader. The reader measures fluorescence (FAM) in each droplet.
- Analyze using QuantaSoft software. Set amplitude threshold to distinguish positive from negative droplets. The software calculates the absolute concentration (copies/μL) using Poisson statistics: Concentration = -ln(1 - p) / (Vdroplet), where p = fraction of positive droplets.
Protocol: Single-Molecule RNA FISH (Basic Workflow)
A. Probe Design & Labeling:
- Design ~20-50 oligonucleotide probes (20mers) complementary to different regions of the target mRNA. Each probe is conjugated to a fluorophore (e.g., Cy5) via a chemical linker.
B. Cell Fixation, Permeabilization, & Hybridization:
- Culture cells on a glass-bottom dish. Fix with 4% formaldehyde for 10 min at room temperature (RT). Wash with PBS.
- Permeabilize with 70% ethanol overnight at 4°C.
- Pre-hybridize with wash buffer (10% formamide, 2x SSC) for 5 min.
- Hybridize with smFISH probe set (100 nM final concentration in hybridization buffer: 10% formamide, 2x SSC, 10% dextran sulfate) in a dark humid chamber at 37°C for 12-16 hours.
C. Washing, Imaging, & Analysis:
- Wash twice with wash buffer at 37°C for 30 min each. Counterstain nuclei with DAPI (300 nM in PBS) for 5 min.
- Image using a widefield or confocal microscope with a high-numerical-aperture objective and a sensitive camera (EMCCD/sCMOS).
- Identify individual RNA molecules as diffraction-limited spots using automated detection software (e.g., FISH-quant, StarSearch). Count spots per cell.
Visualization of Workflows and Relationships
qPCR Workflow and Quantification Output
ddPCR Partitioning and Absolute Quantification
RNA Quantification Informs the Central Dogma
The Scientist's Toolkit: Key Research Reagent Solutions
Table 2: Essential Reagents and Materials for RNA Quantification
| Item | Function & Principle | Example Brands/Products |
|---|---|---|
| DNase I, RNase-free | Degrades contaminating genomic DNA in RNA preps to prevent false-positive amplification in PCR. | Thermo Fisher, Qiagen, Promega |
| RiboLock RNase Inhibitor | Protects RNA templates during reverse transcription by inhibiting RNases. | Thermo Fisher |
| High-Capacity cDNA Reverse Transcription Kit | Contains optimized buffers, dNTPs, random hexamers/oligo(dT), and reverse transcriptase for efficient first-strand cDNA synthesis. | Applied Biosystems |
| SYBR Green or TaqMan Master Mix | Contains hot-start DNA polymerase, dNTPs, buffer, and the fluorescent detection chemistry (intercalating dye or hydrolysis probe) for qPCR. | Bio-Rad, Thermo Fisher, Roche |
| ddPCR Supermix for Probes | Optimized reaction mix for digital PCR, containing polymerase, dNTPs, and stabilizers for droplet integrity. | Bio-Rad |
| Droplet Generation Oil & Cartridges | Creates a water-in-oil emulsion to partition the PCR reaction into uniform nanoliter droplets. | Bio-Rad (DG8 Cartridges, Droplet Generation Oil) |
| smFISH Oligo Probe Sets | Fluorescently labeled oligonucleotide sets targeting single RNA molecules with high specificity and signal-to-noise. | Biosearch Technologies (Stellaris), LGC |
| Hybridization Buffer with Formamide | Creates stringent conditions for specific smFISH probe binding while reducing background. | Commercial kits or lab-made (10% formamide, 2x SSC) |
| Nuclease-Free Water | Solvent for all reaction setups, free of RNases and DNases to prevent sample degradation. | Various (Ambion, Sigma) |
| Validated Primer/Probe Assays | Pre-designed, QC-tested assays for specific genes or miRNAs, ensuring reliability and reproducibility. | Thermo Fisher (TaqMan), IDT, Bio-Rad |
The central dogma of molecular biology outlines the unidirectional flow of information from DNA to RNA to protein. Traditional bulk sequencing and proteomics have elucidated this flow in homogenized samples, averaging signals across millions of cells and obscuring critical tissue context. Spatial transcriptomics and proteomics represent a paradigm shift, enabling the mapping of RNA and protein expression within the intact architectural framework of tissues. This integration provides a spatially resolved, multi-omic understanding of gene expression regulation, capturing the precise cellular neighborhoods, stromal interactions, and metabolic zonation that dictate biological function and disease pathology. This guide details the technical foundations of these fields within the thesis of understanding the spatially regulated flow of biological information.
Core Spatial Transcriptomics Technologies: Methodologies & Protocols
Methodology: Imaging-BasedIn SituSequencing (ISS)
This approach directly reads RNA sequences within tissue sections.
- Experimental Protocol:
- Tissue Preparation: Fresh-frozen or FFPE tissue sections are mounted on glass slides.
- Permeabilization & Reverse Transcription: Tissue is permeabilized. mRNA is reverse transcribed using gene-specific primers containing a spacer and a ligator sequence.
- Padlock Probe Hybridization & Ligation: Padlock probes, complementary to the cDNA target, hybridize and are circularized by ligation.
- Rolling Circle Amplification (RCA): The circularized padlock probe acts as a template for RCA, generating a concatemeric amplicon (a "rolling circle product" or RCP) co-localized with the original mRNA.
- In Situ Sequencing: Fluorescently labeled, circularizable probes complementary to specific sequences within the RCP are hybridized, imaged, and then cleaved. Multiple cycles of hybridization, imaging, and cleavage decode the sequence.
- Key Data Output: Absolute coordinates for hundreds of pre-defined RNA targets.
Methodology:In SituCapture (e.g., Visium/HD by 10x Genomics)
This approach captures polyadenylated mRNAs onto a spatially barcoded array.
- Experimental Protocol:
- Array Preparation: A glass slide contains ~5,000-20,000 barcoded spots, each with millions of oligonucleotides containing a spatial barcode, a Unique Molecular Identifier (UMI), and a poly(dT) sequence.
- Tissue Sectioning & Staining: A fresh-frozen tissue section (typically 5-10 µm) is placed onto the array, H&E stained, and imaged.
- Permeabilization & Capture: Tissue is permeabilized to release mRNAs, which are captured by the poly(dT) sequences on the array.
- On-Slide cDNA Synthesis: Captured mRNAs are reverse transcribed into cDNA, incorporating the spatial barcode and UMI.
- Library Prep & Sequencing: cDNA is harvested, and a sequencing library is constructed. NGS generates reads containing the spatial barcode (for location) and the gene sequence (for identity). UMIs enable digital quantitation.
- Key Data Output: Genome-wide expression profiles for each spatially barcoded spot (55-100 µm resolution), aligned to H&E morphology.
Quantitative Data Comparison: Spatial Transcriptomics Platforms
| Platform | Technology Principle | Resolution | Multiplexity | Throughput | Primary Application |
|---|---|---|---|---|---|
| 10x Visium/HD | In situ capture | 55 µm (HD: 2 µm) | Whole transcriptome (~20k genes) | High (full slide) | Unbiased discovery, spatial mapping of cell types |
| NanoString GeoMx DSP | UV-cleavable oligo barcodes | ROI-driven (5-600 µm) | Whole transcriptome or curated panels | High (multiplexed ROI) | Profiling of user-defined regions of interest |
| MERFISH/seqFISH | Imaging-based, smFISH | Single-cell / subcellular | 100s - 10,000+ genes | Moderate (FOV limited) | Ultra-high-plex subcellular mapping, cell atlases |
| Xenium (10x) | In situ sequencing | Single-cell / subcellular | 100s - 1,000+ genes | High (full slide) | Targeted high-resolution mapping in tissue context |
| CosMx (NanoString) | In situ sequencing | Single-cell / subcellular | 1,000 - 6,000+ RNAs/proteins | High (full slide) | Highly multiplexed co-detection of RNA and protein |
Core Spatial Proteomics Technologies: Methodologies & Protocols
Methodology: Multiplexed Ion Beam Imaging (MIBI)
Uses metal-tagged antibodies and time-of-flight secondary ion mass spectrometry (ToF-SIMS).
- Experimental Protocol:
- Antibody Tagging: Primary antibodies are conjugated to pure elemental metal isotopes (e.g., lanthanides).
- Tissue Staining: A tissue section is stained with a cocktail of 40-100+ metal-tagged antibodies.
- Imaging with ToF-SIMS: The tissue is bombarded with a focused primary ion beam, which ablates the top layer of atoms. The ejected secondary ions (including the metal tags) are analyzed by a mass spectrometer.
- Pixel-by-Pixel Decoding: The mass spectrum at each pixel (1 µm resolution) is deconvoluted to quantify the abundance of each metal tag, translating to protein expression levels.
- Key Data Output: High-dimensional protein expression maps at subcellular resolution.
Methodology: Imaging Mass Cytometry (IMC)
Uses metal-tagged antibodies and laser ablation coupled to mass cytometry (CyTOF).
- Experimental Protocol:
- Antibody Tagging: Similar to MIBI, antibodies are tagged with metal isotopes.
- Tissue Staining & Lasing: A stained tissue section is ablated spot-by-spot (1 µm) by a UV laser.
- Mass Cytometry Analysis: The ablated material is aerosolized and fed into a CyTOF mass cytometer, which quantifies the metal isotopes.
- Image Reconstruction: The quantified data from each ablation spot is reassembled into a quantitative image.
- Key Data Output: Multiplexed protein expression (up to ~40 markers) across full tissue sections.
Quantitative Data Comparison: Spatial Proteomics Platforms
| Platform | Detection Method | Resolution | Multiplexity | Throughput | Key Advantage |
|---|---|---|---|---|---|
| MIBI | ToF-SIMS (mass spec) | ~200 nm - 1 µm | Very High (50-100+) | Moderate | Highest multiplexity & subcellular resolution |
| Imaging Mass Cytometry | Laser Ablation + CyTOF | 1 µm | High (up to ~40) | High | Robust, quantitative, combines with cytometry |
| CODEX/ PhenoCycler | Cyclic Immunofluorescence | ~260 nm | High (50-100+) | High | Standard fluorescence microscopes, high resolution |
| GeoMx DSP (Protein) | UV-cleavable oligo barcodes | ROI-driven | High (up to ~150) | High (ROI) | Whole-slide ROI analysis, integrates RNA |
Integrated Spatial Multi-Omic Analysis Workflow
Diagram Title: Spatial Multi-Omic Data Integration Pipeline
The Scientist's Toolkit: Essential Research Reagents & Materials
| Item Category | Specific Example/Name | Function |
|---|---|---|
| Spatial Transcriptomics | Visium Spatial Gene Expression Slide & Kit (10x Genomics) | Contains barcoded oligonucleotide array for spatially-resolved whole transcriptome capture. |
| Spatial Proteomics | Maxpar Antibody Labeling Kit (Standard BioTools) | Conjugates pure metal isotopes to antibodies for use in IMC or MIBI. |
| Multi-Omic | GeoMx Human Whole Transcriptome Atlas & Protein Core (NanoString) | Combined RNA and protein profiling from the same ROI on a single slide. |
| Tissue Preservation | OCT Compound (Tissue-Tek) | Optimal Cutting Temperature medium for embedding and cryosectioning fresh-frozen tissue. |
| Tissue Adhesion | Poly-L-Lysine or charged slides | Ensures tissue adherence during rigorous enzymatic and washing steps. |
| Permeabilization | Proteinase K, Pepsin, or proprietary enzymes (e.g., Visium Enzyme) | Digests tissue to allow probe/antibody penetration and RNA release/capture. |
| NGS Library Prep | TruSeq or Splicedium kits (for capture-based methods) | Prepares cDNA libraries from captured RNA for downstream sequencing. |
| Image Registration | Akoya CODEX Instrument/Kit or manual alignment software (e.g., ASHLAR) | Enables cyclic staining and automated image alignment for high-plex IF. |
| Data Analysis | Spaceranger, MCMICRO, Squidpy, Giotto, Seurat | Standardized pipelines for processing, visualizing, and analyzing spatial omics data. |
Signaling Pathway Mapping within Tissue Architecture
Spatial omics data can be used to reconstruct active signaling pathways between neighboring cells.
Diagram Title: Cell-Cell Signaling Inferred from Spatial Data
Data Integration & Analysis Protocol
- Step 1: Preprocessing & Alignment. Run platform-specific pipelines (e.g.,
spacerangerfor Visium, MCMICRO for IMC). Align sequential tissue sections using landmark-based or elastic registration tools. - Step 2: Cell Segmentation & Feature Extraction. Use H&E/IF/DAPI images to segment cells/nuclei (e.g., with Cellpose, Mesmer). Extract RNA/protein expression counts per cell.
- Step 3: Multi-Omic Integration. Employ joint dimensionality reduction (e.g., MultiVI, totalVI) or canonical correlation analysis (e.g., MOFA+) to align transcriptomic and proteomic modalities at the single-cell/spatial spot level.
- Step 4: Spatially-Aware Clustering & Annotation. Use graph-based clustering that incorporates spatial neighborhood information (e.g., BayesSpace, SpaGCN) to define spatially coherent cell states or niches.
- Step 5: Spatial Pattern & Interaction Analysis.
- Cell-Cell Communication: Infer ligand-receptor interactions between adjacent cell types using tools like CellChat, SpaOTsc, or MISTY.
- Gradient & Niche Detection: Identify expression gradients (e.g., metabolic zonation) using spatial autocorrelation (Moran's I) or trendsceek. Define cellular neighborhoods.
- Step 6: Visualization & Mapping. Project analysis results (clusters, signaling scores, gradients) back onto the tissue image to create spatially resolved maps of biological processes.
The flow of biological information from DNA to RNA to protein, the Central Dogma, provides the fundamental context for all genetic interventions. CRISPR-based technologies have revolutionized our ability to interrogate and manipulate this flow with unprecedented precision. By targeting specific genomic loci, these tools enable directed activation, interference, and editing at the DNA and RNA levels, allowing researchers to dissect gene function, model disease, and develop novel therapeutics.
The CRISPR-Cas system, derived from prokaryotic adaptive immunity, utilizes a guide RNA (gRNA) to direct a Cas protein to a specific DNA sequence. The evolution from a simple DNA cleavage tool to a multifaceted platform hinges on the engineering of catalytically inactive or modified Cas variants fused to effector domains.
- Catalytically Dead Cas9 (dCas9): The foundation for activation and interference technologies. dCas9 retains its DNA-binding ability but lacks endonuclease activity (D10A and H840A mutations in Streptococcus pyogenes Cas9).
- Base Editors: Fusion proteins combining dCas9 with a deaminase enzyme (e.g., cytidine deaminase or adenosine deaminase) to directly convert one base pair to another (C•G to T•A or A•T to G•C) without creating double-strand breaks (DSBs).
- Prime Editors: A more versatile editing system using a Cas9 nickase (H840A mutation) fused to a reverse transcriptase, programmed with a prime editing guide RNA (pegRNA). This allows for targeted insertions, deletions, and all 12 possible base-to-base conversions.
- CRISPR Interference (CRISPRi): dCas9 fused to transcriptional repressor domains (e.g., KRAB) to block transcription initiation or elongation.
- CRISPR Activation (CRISPRa): dCas9 fused to transcriptional activator domains (e.g., VPR, p65AD, SunTag system) to upregulate gene expression.
Quantitative Comparison of CRISPR Technologies
The following table summarizes the key characteristics, efficiencies, and common applications of the primary CRISPR-based modalities.
Table 1: Comparative Analysis of Core CRISPR Technologies
| Technology | Core Components | Primary Action | Typical Editing/Modulation Efficiency* | Key Advantages | Primary Limitations |
|---|---|---|---|---|---|
| CRISPR-Cas9 Nuclease | Wild-type Cas9, sgRNA | Creates DSB, leads to indel mutations via NHEJ/MMEJ or HDR. | 20-80% (varies by cell type, locus) | High-efficiency knockout; relatively simple design. | Off-target effects; reliance on DSB and error-prone repair. |
| Base Editing (CBE/ABE) | dCas9-deaminase fusion, sgRNA | Direct chemical conversion of C•G to T•A (CBE) or A•T to G•C (ABE). | 10-50% (product purity can be >99%) | No DSB required; high product purity; low indel formation. | Restricted to specific base transitions; potential bystander editing. |
| Prime Editing (PE) | Cas9 nickase-RT fusion, pegRNA | "Search-and-replace" editing via reverse transcription of pegRNA template into target site. | 5-30% (varies widely) | Versatile (all 12 base changes, small insertions/deletions); no DSB required; low off-targets. | Lower efficiency in some systems; complex pegRNA design. |
| CRISPR Interference (CRISPRi) | dCas9-KRAB fusion, sgRNA | Epigenetic repression via histone methylation, blocking RNA polymerase. | Knockdown up to 99% (transcript reduction) | Reversible, tunable knockdown; minimal off-target transcriptional effects. | Requires persistent expression; repression may be incomplete. |
| CRISPR Activation (CRISPRa) | dCas9-VPR/p65AD fusion, sgRNA | Recruitment of transcriptional machinery, histone acetylation to promote gene expression. | Up to 1000x induction (varies by locus) | Can activate silenced genes; multiplexing possible; high specificity. | Context-dependent efficiency; potential for overexpression artifacts. |
*Efficiencies are highly dependent on cell type, delivery method, and target locus. Ranges are illustrative based on recent literature (2023-2024).
Detailed Experimental Protocols
Protocol 1: CRISPRi-Mediated Gene Knockdown in Mammalian Cells
Objective: To achieve specific, transcript-level knockdown of a target gene using dCas9-KRAB. Materials: See "The Scientist's Toolkit" below. Procedure:
- gRNA Design: Design a 20-nt spacer sequence targeting the transcriptional start site (TSS) or promoter region (within -50 to +300 bp relative to TSS) of the gene of interest. Use established algorithms (e.g., CHOPCHOP, CRISPick) to minimize off-target potential.
- Cloning: Clone the synthesized oligos encoding the spacer into a lentiviral CRISPRi vector (e.g., pLV hU6-sgRNA hUbC-dCas9-KRAB-T2a-Puro) using BsmBI restriction sites and T4 DNA ligase.
- Lentivirus Production: Co-transfect HEK293T cells with the lentiviral transfer plasmid, psPAX2 (packaging), and pMD2.G (VSV-G envelope) plasmids using a polyethylenimine (PEI) protocol. Harvest virus-containing supernatant at 48 and 72 hours post-transfection.
- Cell Transduction: Transduce target cells (e.g., HeLa, primary fibroblasts) with filtered lentiviral supernatant in the presence of 8 µg/mL polybrene. Spinoculate at 800 x g for 30-60 minutes at 32°C if necessary.
- Selection and Validation: 48 hours post-transduction, begin selection with 2-5 µg/mL puromycin for 3-7 days. Harvest RNA from polyclonal or clonal populations. Validate knockdown via RT-qPCR using SYBR Green chemistry. Normalize to housekeeping genes (e.g., GAPDH, ACTB).
Protocol 2: Prime Editing for Precise Genome Modification
Objective: To install a specific point mutation (e.g., a disease-relevant SNP) without creating a DSB. Materials: See "The Scientist's Toolkit" below. Procedure:
- pegRNA Design: Design the pegRNA using specialized software (e.g., PE-Designer, PrimeDesign). The pegRNA contains: (a) a 13-nt 5' extension (primer binding site, PBS), (b) the reverse transcriptase template (RTT) encoding the desired edit, and (c) a 3' structural motif (e.g., engineered sgRNA scaffold). The nicking sgRNA (ngRNA) is designed to bind to the non-edited strand, 40-90 bp from the pegRNA binding site.
- Plasmid Assembly: Clone the pegRNA and ngRNA sequences into a mammalian expression plasmid (e.g., pCMV-PE2-P2A-GFP, containing the prime editor PE2 protein). Alternatively, deliver as synthetic, chemically modified pegRNA/ngRNA and PE2 mRNA via nucleofection.
- Delivery: For plasmid delivery, transfect target cells using an appropriate method (e.g., Lipofectamine 3000 for HEK293T, nucleofection for primary cells). For RNP-like delivery, electroporate cells with purified PE2 protein and synthetic pegRNA/ngRNA.
- Analysis: Harvest genomic DNA 72-96 hours post-editing. Screen initial efficiency via targeted next-generation sequencing (NGS) of the locus using PCR amplicons. Clonally expand edited cells and sequence individual clones to identify precise edits and rule out byproducts (e.g., indels, unwanted conversions).
The Scientist's Toolkit: Essential Research Reagents
Table 2: Key Reagents for CRISPR Experiments
| Reagent / Material | Function & Description | Example Product/Catalog |
|---|---|---|
| dCas9-KRAB Expression Vector | Stable expression of the CRISPRi effector. Combines dCas9 with the Kruppel-associated box (KRAB) repressor domain. | Addgene #71237 (pLV hU6-sgRNA hUbC-dCas9-KRAB-T2a-Puro) |
| Prime Editor (PE2) Plasmid | Expresses the Cas9 nickase (H840A)-M-MLV reverse transcriptase fusion protein, the core prime editor. | Addgene #132775 (pCMV-PE2-P2A-GFP) |
| Chemically Modified Synthetic pegRNA | Enhances stability and editing efficiency. Contains 5' and 3' end modifications (e.g., 3' inverted dT). | Synthesized via commercial providers (IDT, Synthego). |
| Lentiviral Packaging Plasmids (2nd/3rd Gen) | Required for production of replication-incompetent lentiviral particles for stable delivery. | psPAX2 (Addgene #12260), pMD2.G (Addgene #12259) |
| Next-Generation Sequencing Kit for Amplicons | Validates editing outcomes with high accuracy and quantifies efficiency. | Illumina DNA Prep with Enrichment, Twist Target Enrichment |
| High-Sensitivity DNA Assay Kit | Precisely quantifies genomic DNA or PCR amplicons prior to NGS library prep. | Qubit dsDNA HS Assay Kit (Thermo Fisher) |
| RNP Electroporation Kit | Enables delivery of purified Cas9/dCas9 protein and synthetic gRNA ribonucleoprotein complexes. | Neon Transfection System Kit (Thermo Fisher) |
| Single-Cell Cloning Supplement | Promotes growth and survival of single cells after editing and selection for clonal isolation. | CloneR (Stemcell Technologies) |
Visualization of CRISPR Mechanisms within the Central Dogma
Title: CRISPR Interventions in Central Dogma Flow
Title: Prime Editing Experimental Workflow
CRISPR technologies have provided an unparalleled suite of tools to control the flow of genetic information. From fundamental research that establishes gene function via CRISPRi/a to therapeutic correction of mutations via base and prime editing, these systems allow for hypothesis testing and intervention at every step of the Central Dogma. Future advancements will focus on improving delivery efficiency in vivo, enhancing specificity, and developing new effector domains for expanded epigenetic and transcriptional control, further solidifying CRISPR's role as the cornerstone of modern genetic research and medicine.
The central dogma of molecular biology posits a directional flow of genetic information from DNA to RNA to protein. While foundational, this framework traditionally overlooks the profound cellular heterogeneity present within tissues. Single-cell multi-omics technologies now enable the simultaneous measurement of multiple molecular layers—genome, epigenome, transcriptome, proteome—within individual cells. This whitepaper details how these technologies deconvolute cellular heterogeneity and map the discordances in information flow that underlie development, homeostasis, and disease, providing an unprecedented view of biological systems.
Quantitative Landscape of Single-Cell Multi-Omics Technologies
The following table summarizes the quantitative capabilities, advantages, and limitations of current prominent single-cell multi-omics platforms.
Table 1: Comparison of Current Single-Cell Multi-Omics Platforms
| Platform/Assay | Omics Layers Measured | Typical Cells per Run | Key Measured Features | Primary Limitation |
|---|---|---|---|---|
| 10x Genomics Multiome | ATAC-seq + GEX (RNA) | 5,000 - 20,000 | Chromatin accessibility & transcriptome from same nucleus | No protein or direct DNA mutation data |
| CITE-seq/REAP-seq | GEX (RNA) + Surface Protein | 5,000 - 20,000 | Transcriptome & 10-200+ surface proteins via antibody tags | Limited to surface proteins; no chromatin data |
| DR-seq/scTrio-seq | DNA Copy Number + RNA | 100 - 1,000 | Genomic DNA (CNV) & transcriptome from same cell | Low throughput; technically challenging |
| scATAC-sequencing | Chromatin (Epigenome) | 10,000 - 50,000+ | Genome-wide chromatin accessibility landscapes | Indirect inference of regulation |
| Paired-seq | RNA + Protein (Intracellular) | ~1,000 | Transcriptome & intracellular protein via indexing | Lower throughput; protein multiplexing limited |
Core Experimental Protocols
Protocol: 10x Genomics Single Cell Multiome ATAC + Gene Expression
This protocol details the simultaneous assay of chromatin accessibility and gene expression from a single nucleus.
Key Reagents & Equipment:
- Chromium Next GEM Chip G
- Chromium Next GEM Controller
- Single Cell Multiome ATAC + Gene Expression Reagent Kit
- Nuclei Isolation Kit
- Dual Index Kit TT Set A
- PCR Thermal Cycler
- Bioanalyzer/TapeStation
Procedure:
- Nuclei Isolation: Isolate nuclei from fresh or frozen tissue using a gentle lysis buffer, followed by washing and resuspension in nuclei buffer. Filter through a 40μm flowmi cell strainer.
- Transposition & Partitioning: Combine nuclei with transposase and buffer from the kit. Load the mix, along with Gel Beads containing barcoded oligos for both ATAC and GEX, onto the Chromium Chip. Run on the Controller to generate single-nucleus GEMs (Gel Bead-in-Emulsions).
- In-GEM Reactions: Inside each GEM, two reactions occur:
- ATAC: The transposase fragments accessible chromatin, adding barcoded adapters.
- GEX: Poly-adenylated mRNA is reverse-transcribed into cDNA with a cell barcode and UMI.
- Post-GEM Processing: Break emulsions, pool fractions, and purify DNA (ATAC) and cDNA (GEX) separately.
- Library Construction:
- ATAC Library: Amplify transposed DNA fragments with indexed primers.
- GEX Library: Amplify cDNA and add sample indexes via a second PCR.
- Quality Control & Sequencing: Assess library size distribution (Bioanalyzer). Sequence on an Illumina platform (NovaSeq 6000). ATAC libraries: Paired-end 50bp; GEX libraries: Read1 (28bp for barcode/UMI), Read2 (90bp for transcript).
Protocol: CITE-seq (Cellular Indexing of Transcriptomes and Epigenomes)
This protocol details the measurement of whole transcriptome and surface protein abundance from single cells.
Key Reagents & Equipment:
- TotalSeq Antibodies (BioLegend)
- Single Cell 3' or 5' Reagent Kits (10x Genomics)
- Chromium Controller
- Cell Staining Buffer (PBS + 0.04% BSA)
- Magnetic Separator for Cell Washing
Procedure:
- Antibody Staining: Create a cocktail of TotalSeq antibodies, each conjugated to a unique oligonucleotide barcode. Incubate a single-cell suspension (viability >90%) with the antibody cocktail in cell staining buffer on ice for 30 minutes.
- Cell Washing: Wash cells thoroughly (3-5x) with ample cold staining buffer to remove unbound antibodies. Use a centrifuge or magnetic separator (if cells are bead-bound). Resuspend in PBS + 0.04% BSA at desired concentration (700-1,200 cells/μl).
- Single-Cell Partitioning & Library Prep: Process the stained cell suspension according to the standard 10x Genomics Single Cell 3' or 5' Gene Expression protocol. The antibody-derived tags (ADTs) and transcripts are co-encapsulated, and their oligonucleotides are reverse-transcribed and amplified alongside cellular cDNA.
- Sequencing: Sequence libraries on an Illumina platform. The ADT reads are separated bioinformatically using their distinct primer indices. Analysis involves normalizing protein counts (e.g., using CLR or dsb) alongside transcript UMI counts.
Visualizing Multi-Omic Integration and Information Flow
Diagram 1: Multi-Omic Integration Resolves Information Flow
Diagram 2: Single-Cell Multi-Omics Experimental & Computational Workflow
The Scientist's Toolkit: Key Research Reagent Solutions
Table 2: Essential Reagents & Kits for Single-Cell Multi-Omics Research
| Item Name (Example Vendor) | Category | Primary Function in Workflow |
|---|---|---|
| Chromium Next GEM Single Cell Multiome ATAC + Gene Expression Kit (10x Genomics) | Integrated Assay Kit | Enables simultaneous profiling of chromatin accessibility (ATAC) and transcriptome (RNA) from the same single nucleus. |
| TotalSeq Antibodies (BioLegend) | Protein Detection | Oligonucleotide-tagged antibodies for quantifying surface protein abundance alongside transcriptomes in CITE-seq. |
| Chromium Controller (10x Genomics) | Instrumentation | Automated microfluidic platform for partitioning single cells/nuclei into nanoliter-scale droplets (GEMs). |
| Nuclei Isolation Kits (e.g., from Sigma or 10x) | Sample Prep | Gentle, optimized reagents for liberating intact nuclei from complex tissues for nuclear multi-omics. |
| Dual Index Kit TT Set A (10x Genomics) | Sequencing Reagent | Provides unique dual indices for multiplexing multiple samples in a single sequencing run. |
| LIVE/DEAD Fixable Viability Dyes (Thermo Fisher) | Cell QC | Fluorescent dyes to identify and exclude dead cells during sample preparation, ensuring data quality. |
| Single-Cell Analysis Software (e.g., Cell Ranger ARC, Seurat, Scanpy) | Computational Tool | End-to-end pipelines for processing raw sequencing data, performing multi-omic integration, and downstream analysis. |
In Vitro Transcription/Translation Systems for Synthetic Biology and Drug Screening
The central dogma of molecular biology describes the unidirectional flow of genetic information from DNA to RNA to protein. In vitro transcription/translation (TXTL) systems reconstitute this core flow in a controlled, cell-free environment. These systems serve as a foundational experimental platform for the broader thesis research, enabling precise dissection and engineering of the informational cascade without the complexities of living cells. This technical guide details the current state of TXTL systems as essential tools for synthetic biology and high-throughput drug screening.
Core System Components and Quantitative Comparison
TXTL systems are derived from cellular extracts or composed of purified recombinant elements. The choice of system depends on the application's requirements for yield, duration, cost, and regulatory control.
Table 1: Comparison of Major TXTL System Types
| System Type | Key Components | Reaction Duration | Typical Protein Yield | Primary Advantages | Primary Limitations |
|---|---|---|---|---|---|
| Prokaryotic (E. coli) Extract | E. coli lysate, energy mix, NTPs, amino acids, T7 RNA polymerase. | 2-6 hours | 500-1000 µg/mL | Robust, high yield, cost-effective. | Limited post-translational modifications (PTMs). |
| Eukaryotic (Wheat Germ) Extract | Wheat germ embryo lysate, energy mix, NTPs, amino acids. | 1-3 hours | 50-200 µg/mL | Functional folding of complex eukaryotic proteins; low background. | Lower yield than E. coli; some mammalian PTMs absent. |
| Eukaryotic (Rabbit Reticulocyte) Extract | Rabbit reticulocyte lysate, energy mix, NTPs, amino acids. | 1.5-2 hours | 20-100 µg/mL | Contains mammalian chaperones and some PTM machinery. | High cost, endogenous globin background. |
| Reconstituted (PURE) System | Purified E. coli components: Ribosomes, tRNAs, translation factors, energy regeneration enzymes. | 1-3 hours | 100-300 µg/mL | Defined, minimal background; precise tuning of components. | Very high cost; sensitive to inhibitors; shorter reaction life. |
| Hybrid (HeLa-based) | Human HeLa cell extract, energy mix, NTPs, amino acids, T7 RNA polymerase. | 2-4 hours | 50-150 µg/mL | Supports many mammalian PTMs and folding pathways. | Complex, batch variability, moderate yield. |
Experimental Protocols
Protocol 1: Standard E. coli-Based TXTL Reaction for Rapid Prototyping
This protocol is optimized for high-yield expression of soluble proteins using a commercial E. coli extract system.
- Thaw Components: Rapidly thaw all reagents (extract, energy mix, amino acids, polymerase) on ice. Briefly vortex energy mix and amino acids after thawing.
- Prepare DNA Template: Use a plasmid or linear PCR product containing a T7 promoter, 5' UTR (e.g., T7 gene 10 leader), gene of interest (GOI), and a T7 terminator. Optimal DNA concentration is 5-20 nM for plasmid DNA.
- Assemble Reaction on Ice: In a sterile microtube, combine the following in order:
- Nuclease-free water: to a final volume of 25 µL.
- 10 µL of 2.5X Reaction Mix (contains energy sources, salts, NTPs, amino acids).
- 1 µL (or 5-20 nM) DNA template.
- 1 µL T7 RNA Polymerase (if not pre-mixed in extract).
- 8 µL E. coli Lysate. Mix gently by pipetting. Do not vortex after adding the lysate.
- Incubate: Transfer the reaction to a 30°C heat block or thermal cycler. Incubate for 4-6 hours.
- Analysis: Place reaction on ice. Analyze protein yield via SDS-PAGE, western blot, or a functional assay. For SDS-PAGE, load 2-5 µL of the reaction directly.
Protocol 2: High-Throughput Drug Screening Using a Mammalian TXTL System
This protocol uses a HeLa-based TXTL system to express a target protein (e.g., an enzyme) and screen compound libraries for inhibitory activity in a 384-well format.
- Pre-dispense Compounds: Using an acoustic liquid handler, transfer 50 nL of each test compound (10 mM in DMSO) to individual wells of a low-volume, non-binding 384-well plate. Include DMSO-only wells for positive (no inhibition) and negative (no DNA) controls.
- Prepare Master Mix: On ice, prepare a master mix containing per reaction:
- HeLa Cell Extract: 10 µL
- 2X Reaction Buffer (with NTPs, amino acids, energy mix): 7.5 µL
- T7 RNA Polymerase: 0.5 µL
- DNA Template (encoding target enzyme): 1 µL (to final 2 nM)
- Nuclease-free water: 0.5 µL Keep mix on ice.
- Initiate Reactions: Using a multichannel pipette, dispense 19.5 µL of the master mix into each well of the 384-well plate containing pre-dispensed compounds. Final reaction volume is 20 µL. Centrifuge briefly to collect liquid.
- Incubate and Develop: Seal the plate and incubate at 30°C for 2 hours in a plate reader. Then, automatically inject 20 µL of a fluorescence or luminescence-based substrate mix specific to the expressed enzyme. Measure signal kinetics for 30 minutes.
- Data Analysis: Calculate percent inhibition relative to DMSO control wells (100% activity) and negative control wells (0% activity). Fit dose-response curves for hit compounds.
System Diagrams
Flow of Information in TXTL for Applications
Standard TXTL Experimental Workflow
The Scientist's Toolkit: Key Research Reagent Solutions
Table 2: Essential Materials for TXTL Experiments
| Reagent / Material | Function / Role | Example Vendor / Product | |
|---|---|---|---|
| Coupled TXTL Kit | Provides optimized, co-formulated lysate and master mix for simplified reactions. | NEB PURExpress, Promega TnT, Arbor Technologies myTXTL. | |
| Specialized Lysate | System-specific extract providing core translational machinery and endogenous enzymes. | ThermoFisher HeLa Lysate, CellFree Sciences WEPRO7240. | |
| T7 RNA Polymerase | High-activity polymerase for efficient transcription from T7 promoters. | Nucleoside Triphosphates (NTPs) | The monomeric building blocks (ATP, UTP, GTP, CTP) for RNA synthesis. |
| Energy Regeneration System | Maintains ATP/GTP levels; often includes creatine phosphate & creatine kinase. | Phosphoenolpyruvate (PEP) & Pyruvate Kinase is an alternative. | |
| Amino Acid Mixture | Provides all 20 standard amino acids as substrates for translation. | Methionine or Lysine, labeled for radioactive detection. | |
| RNAse Inhibitor | Protects mRNA templates and products from degradation. | Recombinant RNasin. | |
| Low-Binding Microplates | Minimizes loss of protein/DNA in high-throughput screening setups. | Corning 4514, Greiner 784201. | |
| Linear DNA Template Prep Kit | For generating PCR-amplified templates with required regulatory elements. | NEB Monarch PCR & DNA Cleanup Kit. |
Navigating Experimental Pitfalls: Ensuring Fidelity in Gene Expression Analysis
Within the central dogma of molecular biology, the flow of information from DNA to RNA to protein is fundamental. High-fidelity RNA analysis is therefore critical for accurate interpretation of gene expression and regulation. However, this path is fraught with technical artifacts that can distort biological truth. This guide details three pervasive artifacts—degradation, contamination, and GC bias—providing methodologies for their identification and mitigation.
RNA Degradation
RNA degradation is the enzymatic cleavage of RNA molecules, primarily by ubiquitous RNases. It compromises downstream applications by skewing quantitation, reducing yields, and impairing the detection of full-length transcripts.
Mechanism & Impact: Degradation occurs via endo- and exo-ribonucleases. In RNA-Seq, it causes 3’-bias, where reads map disproportionately to the 3’ end of transcripts, leading to false quantification of gene expression and alternative splicing events.
Detection: The RNA Integrity Number (RIN) assessed by capillary electrophoresis (e.g., Agilent Bioanalyzer) is the gold standard. A RIN ≥ 8 is generally required for most sequencing applications.
Quantitative Data on Degradation Impact: Table 1: Impact of RNA Integrity Number (RIN) on Sequencing Metrics
| RIN Value | DV200 (% >200nt) | Recommended Application | Estimated % Genes Affected by Bias |
|---|---|---|---|
| 10 | >95% | All, esp. Iso-Seq | <5% |
| 8-9.9 | 85-95% | Standard RNA-Seq, qPCR | 5-15% |
| 6-7.9 | 70-85% | Targeted panels | 15-30% |
| <6 | <70% | Not recommended | >30% |
Experimental Protocol: Assessment of RNA Integrity via Bioanalyzer
- Prepare RNA Samples: Dilute RNA to ~50 ng/µL in nuclease-free water.
- Prepare Gel-Dye Mix: Combine 65 µL RNA Gel Matrix with 1 µL RNA Dye Concentrate. Centrifuge and aliquot 9 µL per well.
- Load Gel and Samples: Place the gel in the appropriate chip. Add 5 µL of RNA Marker to each sample well and ladder well. Load 1 µL of RNA ladder (ladder well) and each sample (sample wells).
- Run Assay: Insert chip into the Bioanalyzer 2100 and run the "Eukaryote Total RNA Nano" or "Pico" program.
- Analysis: Software calculates RIN algorithmically based on the entire electrophoretic trace, emphasizing the 18S and 28S ribosomal RNA peaks.
Contamination
Contaminants include genomic DNA (gDNA), protein, phenol, salts, and cross-sample carryover. They inhibit enzymatic reactions and lead to false-positive signals.
gDNA Contamination: Causes amplification of non-transcribed sequences in qPCR and spurious reads in RNA-Seq. Inhibitors: Phenol, ethanol, or salts can reduce reverse transcription and PCR efficiency.
Detection: Spectrophotometric (A260/A280, A260/A230) and fluorometric (Qubit) assays. gDNA contamination can be assessed by no-reverse-transcriptase (-RT) controls in qPCR.
Quantitative Data on Contaminant Effects: Table 2: Spectrophotometric Ratios and Implications
| Contaminant | Affected Ratio (Nanodrop) | Typical Aberrant Value | Impact on cDNA Synthesis Efficiency |
|---|---|---|---|
| Pure RNA | A260/A280 ~2.0 | - | Baseline (100%) |
| Protein | A260/A280 < 1.8 | ~1.5 | Reduced by 20-40% |
| Phenol/Guanidine | A260/A230 < 2.0 | <1.5 | Reduced by 50-70% |
| gDNA (1% w/w) | Minimal change | - | Causes false-positive signal |
Experimental Protocol: DNase I Treatment for gDNA Removal
- Set Up Reaction: Combine 1-5 µg RNA, 1 µL 10X DNase I Buffer, 1 µL RNase-free DNase I (1 U/µL), and Nuclease-free water to 10 µL.
- Incubate: 30 minutes at 37°C.
- Inactivate: Add 1 µL of 50 mM EDTA (chelates Mg2+ required for DNase activity) and heat at 65°C for 10 minutes.
- Purify: Clean up RNA using a silica-membrane column or ethanol precipitation to remove enzymes, EDTA, and digested DNA.
GC Bias
GC bias refers to the non-uniform amplification or sequencing efficiency of RNA/DNA fragments based on their guanine-cytosine (GC) content. It arises during cDNA synthesis, PCR amplification, and cluster generation in NGS, leading to under- or over-representation of GC-rich or GC-poor transcripts.
Impact in RNA-Seq: Creates systematic errors in gene expression quantification, confounding differential expression analysis.
Mitigation: Use of PCR-free library prep protocols is ideal but often impractical for low-input RNA. Enzymes and buffers optimized for high-GC content and limited, balanced PCR cycles are key.
Quantitative Data on GC Bias: Table 3: Effect of GC Content on Sequencing Output
| GC Content Range | Expected Representation (Unbiased) | Typical Observed Bias (Standard Polymerase) | Bias with Optimized Polymerase |
|---|---|---|---|
| <30% | 100% | 65-80% | 90-105% |
| 40-60% | 100% | 95-105% | 98-102% |
| >70% | 100% | 50-70% | 85-95% |
Experimental Protocol: Assessing GC Bias in RNA-Seq Libraries
- Library Preparation: Prepare sequencing libraries from a standardized, complex RNA sample (e.g., Universal Human Reference RNA) using your standard protocol.
- Sequencing: Perform shallow sequencing (e.g., 5M reads) on a consistent platform.
- Bioinformatic Analysis: a. Alignment: Map reads to the reference genome using a splice-aware aligner (e.g., STAR). b. GC Content Calculation: For each gene/transcript, calculate the GC% of its exonic sequence. c. Read Count Normalization: Obtain normalized read counts (e.g., TPM, FPKM). d. Visualization: Plot normalized expression levels (log2) against GC content for all detected genes. A loess curve will reveal systematic bias.
Visualizing the Artifact Landscape in RNA Workflow
Title: RNA Workflow Steps and Associated Artifacts
The Scientist's Toolkit: Key Reagent Solutions
Table 4: Essential Reagents for Mitigating RNA Artifacts
| Reagent/Material | Primary Function | Specific Role in Artifact Mitigation |
|---|---|---|
| RNase Inhibitors (e.g., Recombinant RNasin) | Binds and inactivates RNases. | Prevents RNA degradation during extraction and handling. |
| DNase I, RNase-free | Degrades single/double-stranded DNA. | Removes genomic DNA contamination from RNA preparations. |
| SPRI Beads (Solid Phase Reversible Immobilization) | Selective nucleic acid binding and purification. | Removes contaminants (salts, proteins, organics) and size-selects RNA/cDNA. |
| dNTPs, PCR Grade | Building blocks for cDNA synthesis and PCR. | High-purity dNTPs prevent incorporation errors and inhibition. |
| PCR Polymerase for High GC (e.g., GC-rich kits) | Amplifies difficult templates. | Reduces GC bias during library amplification. |
| Ribonuclease H (RNase H) | Degrades RNA in RNA-DNA hybrids. | Improves strand specificity and reduces artifacts in 2nd strand cDNA synthesis. |
| ERCC RNA Spike-In Mix | Exogenous synthetic RNA controls. | Quantifies technical noise, detects GC bias, and normalizes across runs. |
| RNA Storage Buffer (Stabilizing, e.g., with EDTA) | Long-term RNA storage. | Chelates metal ions and inhibits RNase activity to prevent degradation. |
Optimizing Primer/Probe Design for Specific and Efficient Target Capture
Within the central dogma of molecular biology—the flow of genetic information from DNA to RNA to protein—the precise detection and quantification of nucleic acids is foundational. This whitepaper provides an in-depth technical guide for designing primers and probes to achieve specific and efficient target capture, a critical step in techniques like qPCR, ddPCR, and next-generation sequencing that underpin modern genomics, transcriptomics, and diagnostic research.
Core Principles of Design
Sequence Specificity and Avoidance of Secondary Structures
Primers and probes must be unique to the target sequence to avoid off-target binding. Key parameters include:
- Specificity Verification: Use BLAST against the relevant genome database.
- Secondary Structures: Minimize hairpins, self-dimers, and cross-dimers, which impede hybridization.
- Thermodynamic Stability: The 3' end of a primer should be more stable (higher ΔG) than the 5' end to promote correct initiation.
Thermodynamic Parameters
Optimal binding is governed by melting temperature (Tm). Consistent Tm between forward and reverse primers is crucial.
- Tm Calculation: The nearest-neighbor method is most accurate.
- Probe Tm: Should be 5-10°C higher than primer Tm to ensure probe binding prior to primer extension.
Probe Chemistry and Quenching
Selection of fluorophore, quencher, and chemistry (e.g., TaqMan, Molecular Beacons, Scorpions) dictates signal-to-noise ratio.
Table 1: Common Fluorophore-Quencher Pairs for Hydrolysis Probes
| Fluorophore | Quencher | Emission Wavelength (nm) | Common Application |
|---|---|---|---|
| FAM | BHQ-1 or TAMRA | 518 | High sensitivity, standard gene expression |
| HEX/VIC | BHQ-1 | 556 | Multiplexing (with FAM) |
| Cy5 | BHQ-2 | 670 | High-level multiplexing |
| ROX | BHQ-2 | 608 | Often used as a passive reference |
Quantitative Design Parameters and Guidelines
Table 2: Optimal Design Parameters for Primers and Probes
| Component | Length (bases) | GC Content (%) | Melting Temp (Tm) | Additional Constraints |
|---|---|---|---|---|
| PCR Primer | 18-25 | 40-60% | 55-65°C (within 1°C pair) | Avoid 3' G/C clamp; No poly-bases |
| qPCR Probe | 15-30 | 40-60% | 65-72°C (7-10°C > primer) | Place within amplicon; Avoid 5' G |
| Amplicon | 80-150 (qPCR) | - | - | Shorter for degraded FFPE RNA |
Experimental Protocol: In Silico Design and Validation Workflow
Title: Primer/Probe Design & Validation Workflow
Detailed Protocol Steps:
- Target Identification: Retrieve the exact genomic (for DNA) or cDNA (for RNA) sequence from a curated database (e.g., NCBI Nucleotide, Ensembl). For mRNA targets, consider exon-exon junctions to ensure cDNA-specific amplification.
- Sequence Alignment: Align related sequences (e.g., different splice variants, homologous genes) to identify unique regions for high specificity.
- Oligo Design: Using software (e.g., Primer3, NCBI Primer-BLAST), design primers with parameters from Table 2. For probes, avoid sequences with runs of identical nucleotides and ensure no overlap with primer binding sites.
- Specificity Check: Perform a nucleotide BLAST (blastn) against the appropriate reference genome with stringent parameters. Expect exact match only to the intended target.
- Structural Analysis: Use tools like OligoAnalyzer (IDT) or mFold to calculate potential for secondary structure (ΔG > -2 kcal/mol acceptable) and primer-dimer formation (ΔG > -5 kcal/mol acceptable).
- Parameter Calculation: Confirm Tm using the nearest-neighbor method (e.g., via
OligoCalc). Ensure probe Tm is sufficiently higher than primer Tm. - Empirical Validation: Dilute template to create a standard curve (e.g., 5-log range). Run qPCR and calculate amplification efficiency (E) from the slope: E = 10^(-1/slope) - 1. Optimal efficiency is 90-110% (slope of -3.1 to -3.6). Assess specificity via melt curve analysis (for intercalating dyes) or by ensuring no signal in no-template controls.
Visualization: Role in the Central Dogma Research Pathway
Title: Target Capture in Central Dogma Analysis
The Scientist's Toolkit: Essential Research Reagents
Table 3: Key Reagent Solutions for Primer/Probe Validation
| Reagent/Material | Function | Key Consideration |
|---|---|---|
| High-Fidelity DNA Polymerase | Amplifies template for standard curve generation. | Low error rate ensures sequence fidelity of cloned standards. |
| Reverse Transcriptase (RT) | Converts RNA to cDNA for gene expression analysis. | Choose RNase H- variants for higher yield of long cDNA. |
| Hot-Start Taq DNA Polymerase | Prevents non-specific amplification during qPCR setup. | Critical for low-copy number targets and multiplex assays. |
| dNTP Mix | Nucleotides for DNA strand elongation. | Use balanced, high-purity mixes for optimal fidelity and yield. |
| Optimized Buffer Systems | Provides optimal pH, ionic strength, and co-factors (Mg2+). | Mg2+ concentration often requires titration (1.5-4.0 mM). |
| Quenchered Probes (TaqMan) | Sequence-specific detection with high signal-to-noise. | Dual-quenched probes (e.g., with ZEN/Iowa Black) offer lower background. |
| Nuclease-Free Water | Solvent for all reaction components. | Essential to avoid RNase/DNase contamination. |
| Standard Template (gDNA, Plasmid) | For generating a calibration curve to calculate efficiency. | Serial dilutions must span 5-6 orders of magnitude. |
Mitigating Off-Target Effects in CRISPR and RNAi Experimental Designs
The flow of biological information from DNA to RNA to protein—the Central Dogma—is the fundamental axis of genetic research and therapeutic intervention. CRISPR-Cas gene editing and RNA interference (RNAi) are powerful technologies that operate at the DNA and RNA levels, respectively, to modulate this flow and elucidate gene function. However, a critical challenge undermining their precision is off-target activity, where unintended genomic loci or transcripts are modified or silenced. This whitepaper provides an in-depth technical guide for researchers and drug development professionals to design robust experiments that mitigate off-target effects, thereby ensuring data fidelity and therapeutic safety.
Quantitative Landscape of Off-Target Effects
Table 1: Comparative Analysis of CRISPR and RNAi Off-Target Profiles
| Parameter | CRISPR-Cas9 (sgRNA-dependent) | RNAi (siRNA/shRNA) |
|---|---|---|
| Primary Mechanism | DNA double-strand break at target locus | mRNA degradation or translational inhibition |
| Typical Off-Target Rate | Up to 50% for poorly designed guides (1) | Can exceed 70% for standard siRNAs (2) |
| Major Off-Target Cause | Seed region mismatches (PAM-proximal 8-12 nt) | Seed region homology (nt 2-8 of guide strand) |
| Key Prediction Metric | Cutting Frequency Determination (CFD) score | Seed region duplex stability (ΔG) |
| Common Validation Assay | GUIDE-seq, CIRCLE-seq, WGS | RNA-seq, RISC-CLIP |
Sources: (1) Hsu et al., Nat Biotechnol 2013; (2) Jackson et al., RNA 2003. Live search corroborated with recent reviews (2023-2024).
Experimental Protocols for Off-Target Assessment & Mitigation
Protocol 3.1: In vitro GUIDE-seq for Unbiased CRISPR Off-Target Detection
Objective: Genome-wide identification of Cas9 off-target cleavage sites.
Materials:
- Cultured target cells (e.g., HEK293T).
- Cas9 nuclease and candidate sgRNA.
- GUIDE-seq oligonucleotide duplex (tagged dsODN).
- PCR reagents for nested PCR.
- High-throughput sequencing platform.
Procedure:
- Transfection: Co-transfect 500,000 cells with 30 pmol of Cas9 ribonucleoprotein (RNP) complex and 100 pmol of dsODN using electroporation.
- Genomic DNA Extraction: Harvest cells 72h post-transfection. Extract gDNA using a magnetic bead-based kit.
- Tagged Fragment Enrichment: Shear gDNA to ~500 bp. Perform end-repair and A-tailing. Ligate sequencing adapters with a splinter oligo complementary to the integrated dsODN.
- Nested PCR: Perform two rounds of PCR (15 cycles each) with primers specific to the adaptor and dsODN tag. Use barcoded primers for multiplexing.
- Sequencing & Analysis: Sequence on Illumina MiSeq (2x150 bp). Align reads to reference genome (e.g., hg38) using GUIDE-seq analysis software (e.g.,
guideseqpackage) to identify integration sites indicative of off-target double-strand breaks.
Protocol 3.2: RISC-CLIP for Mapping RNAi Off-Target Engagements
Objective: Directly identify transcripts bound by the RNA-Induced Silencing Complex (RISC) loaded with an siRNA of interest.
Materials:
- Cells expressing FLAG/HA-tagged Ago2.
- siRNA of interest and transfection reagent.
- UV cross-linker (254 nm).
- Anti-FLAG magnetic beads.
- Phosphatase, polynucleotide kinase, and protease inhibitors.
- RNA-seq library preparation kit.
Procedure:
- RISC Loading & Crosslinking: Transfect tagged cells with 20 nM siRNA. At 24h, wash cells and irradiate once with 150 mJ/cm² at 254 nm to crosslink Ago2 to bound RNA.
- Cell Lysis & Immunoprecipitation: Lyse cells in stringent RIPA buffer. Incubate lysate with anti-FLAG beads for 4h at 4°C. Wash extensively with high-salt buffer.
- RNA Processing: On-bead, treat with phosphatase, then polynucleotide kinase. Digest proteins with Proteinase K. Recover crosslinked RNA fragments.
- Library Prep & Sequencing: Construct cDNA library. Sequence deeply (Illumina). Align reads (allowing 1-2 mismatches) to identify all Ago2-bound transcripts, revealing direct off-targets.
Strategic Mitigation: From Design to Validation
CRISPR-Specific Strategies:
- Use High-Fidelity Cas Variants: Utilize engineered variants like SpCas9-HF1 or eSpCas9(1.1) with reduced non-specific DNA contacts.
- Optimize sgRNA Design: Leverage algorithms (e.g., from Broad Institute's GPP portal) that integrate specificity scores (CFD, MIT). Avoid guides with high homology to repetitive regions.
- Employ "Double Nicking": Use paired Cas9 nickases (D10A mutant) with offset sgRNAs to generate a double-strand break, dramatically increasing specificity.
- Predict with in vitro Assays: Pre-screen sgRNAs using CIRCLE-seq, an in vitro, high-sensitivity method that circularizes genomic DNA and enriches for Cas9-cleaved fragments for sequencing.
RNAi-Specific Strategies:
- Rational siRNA Design: Follow "Tuschl rules": avoid bases 13-19 in the sense strand to reduce RISC loading asymmetry. Favor low stability (low ΔG) at the 5' end of the antisense (guide) strand.
- Chemical Modifications: Incorporate 2'-O-methyl modifications at positions 2 and 5 of the guide strand to reduce seed-mediated off-targeting.
- Use Pooled siRNA or shRNA Libraries: Utilize well-designed pools of multiple siRNAs targeting the same gene to dilute out individual off-target effects.
- Prefer endogenously expressed miR-30 based shRNAs for stable expression, as they are processed via the natural microRNA pathway, which can enhance fidelity.
Visualizing Strategies and Workflows
Diagram Title: CRISPR & RNAi Mitigation Workflow Comparison
Diagram Title: Off-Target Effects on Central Dogma Flow
The Scientist's Toolkit: Essential Reagent Solutions
Table 2: Key Research Reagents for Off-Target Mitigation
| Reagent / Material | Provider Examples | Primary Function in Mitigation |
|---|---|---|
| Alt-R S.p. HiFi Cas9 Nuclease | Integrated DNA Technologies (IDT) | High-fidelity Cas9 variant for reduced off-target cleavage. |
| TrueGuide Synthetic sgRNA | Thermo Fisher Scientific | Chemically modified sgRNA with improved stability and specificity. |
| Dharmacon SMARTselection siRNA Pools | Horizon Discovery | Predesigned, pooled siRNAs to minimize individual off-target effects. |
| 2'-O-methyl Modified RNA Nucleotides | TriLink BioTechnologies | For custom siRNA synthesis to reduce seed-mediated off-targeting. |
| GUIDE-seq Kit | Integrated DNA Technologies (IDT) | All-in-one kit for unbiased, genome-wide off-target detection. |
| CIRCLE-seq Kit | Various Core Services | In vitro, highly sensitive NGS-based off-target identification. |
| Anti-Ago2 (C34C6) Antibody | Cell Signaling Technology | For RISC-CLIP protocols to capture siRNA-loaded RISC complexes. |
| Lenti-shRNA miR-30 based Libraries | VectorBuilder | For stable, inducible knockdown with potentially enhanced fidelity. |
| Next-Generation Sequencing Kits (Illumina) | Illumina, Inc. | Essential for all genome-wide and transcriptome-wide validation assays. |
Best Practices for Sample Preparation in NGS to Maintain Transcript Integrity
The accurate flow of biological information from DNA to RNA to protein is a cornerstone of molecular biology. Next-Generation Sequencing (NGS) of transcripts (RNA-Seq) provides a powerful snapshot of this flow, capturing the RNA intermediary. The fidelity of this snapshot is wholly dependent on the integrity of the input RNA. Degraded transcripts introduce bias, obscuring true expression levels, splice variants, and novel isoforms, thereby compromising downstream interpretation of gene regulation and protein potential. This guide details the critical, pre-analytical best practices to preserve transcript integrity from sample collection to library preparation.
Critical Pre-Analytical Variables: From Collection to Storage
Table 1: Quantitative Impact of Pre-Analytical Variables on RNA Integrity Number (RIN)
| Variable | High-Integrity Condition | Low-Integrity Condition | Typical RIN Impact | Key Rationale |
|---|---|---|---|---|
| Collection Delay | Immediate stabilization/freezing | 30-minute delay at room temp | 9-10 → 6-7 | Rapid induction of RNase activity and stress-response genes. |
| Stabilization Method | Liquid nitrogen or dedicated RNAlater | None (directly to -80°C) | 9-10 vs 7-8* | Chemical stabilizers inactivate RNases faster than temperature drop alone. |
| Storage Temperature | -80°C or liquid N₂ | -20°C for long-term | < -1 RIN/year at -80°C vs significant loss at -20°C | Reduced enzymatic and chemical degradation. |
| Freeze-Thaw Cycles | 0-1 cycles | ≥3 cycles | >1 RIN loss per 2-3 cycles | Ice crystal formation and RNase release upon thawing. |
| Tissue Type | Homogeneous, low-RNase (e.g., muscle) | High-RNase, heterogeneous (e.g., pancreas, gut) | Inherent 1-3 point RIN difference | Endogenous RNase content varies dramatically. |
*Effect is tissue-dependent.
Core Methodologies for High-Integrity RNA Isolation
Protocol: Guanidinium Thiocyanate-Phenol-Chloroform Extraction (e.g., TRIzol)
Principle: Simultaneous lysis and denaturation of RNases using a monophasic solution of phenol and guanidine isothiocyanate, followed by phase separation.
- Homogenization: Homogenize tissue/cells in TRIzol reagent (1ml per 50-100mg tissue) using a motorized homogenizer. Keep samples cold.
- Phase Separation: Add 0.2ml chloroform per 1ml TRIzol. Vortex vigorously for 15 seconds. Incubate at room temperature for 2-3 minutes.
- Centrifugation: Centrifuge at 12,000 × g for 15 minutes at 4°C. The mixture separates into: a lower red phenol-chloroform phase, an interphase, and a colorless upper aqueous phase containing RNA.
- RNA Precipitation: Transfer the aqueous phase to a new tube. Precipitate RNA by adding 0.5ml isopropanol per 1ml TRIzol used. Incubate at room temperature for 10 minutes.
- Wash: Centrifuge at 12,000 × g for 10 minutes at 4°C. Remove supernatant. Wash pellet with 75% ethanol (in DEPC-treated water). Vortex and centrifuge at 7,500 × g for 5 minutes.
- Redissolution: Air-dry pellet briefly (5-10 minutes). Dissolve RNA in RNase-free water or buffer.
Protocol: Silica-Membrane Column-Based Purification
Principle: Selective binding of RNA to a silica membrane in the presence of a high-salt chaotropic buffer, followed by washes and elution.
- Lysis & Homogenization: Lyse samples in a buffer containing a strong denaturant (e.g., guanidine salts) and a detergent. Homogenize using appropriate method (filter columns, homogenizer).
- Binding: Apply lysate to a silica-membrane column. Centrifuge. High-salt conditions promote RNA binding to the membrane while contaminants pass through.
- Wash: Perform 2-3 wash steps with ethanol-containing buffers to remove salts, metabolites, and other impurities without eluting RNA.
- DNase Digestion (On-Column): Apply an RNase-free DNase I solution directly to the membrane. Incubate at room temperature for 15 minutes to remove genomic DNA contamination.
- Final Wash & Elution: Perform a final wash. Elute pure RNA in a low-salt buffer or nuclease-free water by centrifugation.
Table 2: Comparison of Core RNA Isolation Methodologies
| Feature | Guanidinium-Phenol-Chloroform | Silica-Membrane Column |
|---|---|---|
| Typical RIN Yield | High (8-10) | High (8-10) |
| Throughput | Lower, more manual | High, amenable to automation |
| Genomic DNA Contamination | Likely, requires separate DNase step | Easily addressed with on-column DNase |
| Handling Hazard | High (toxic phenol/chloroform) | Low |
| Recovery of Small RNAs | Excellent, recovers all RNAs | Dependent on column chemistry; specific kits available |
| Cost per Sample | Low | Higher |
Integrity Assessment and Library Preparation Strategy
Assessment: Use an Agilent Bioanalyzer or TapeStation to generate an RNA Integrity Number (RIN). For NGS, aim for RIN > 8 for standard mRNA-Seq and RIN > 9 for long-read or full-length transcript sequencing.
Library Prep Selection: The choice of library preparation kit must align with RNA integrity.
- High Quality (RIN > 8): Use standard poly-A enrichment kits for mRNA-Seq or ribodepletion kits for total RNA-Seq.
- Moderate Quality (RIN 5-7): Employ ribodepletion kits designed for degraded RNA (e.g., those using rRNA probes). Target enrichment or 3'-end counting protocols (e.g., QuantSeq) are robust alternatives.
- Low Quality (RIN < 5) or FFPE: Utilize kits specifically optimized for fragmented RNA, often involving random priming and chemical fragmentation steps are omitted.
Decision Workflow for NGS Library Prep Based on RNA Integrity
The Scientist's Toolkit: Essential Research Reagent Solutions
Table 3: Key Reagents for RNA Integrity Preservation
| Item | Function & Importance | Example Brands/Types |
|---|---|---|
| RNase Inhibitors | Proteins that non-covalently bind RNases, inactivating them. Critical for all post-homogenization steps. | Recombinant RNasin, SUPERase•In, PROTECTOR RNase Inhibitor. |
| Chemical Stabilizers | Solutions that rapidly permeate tissue to denature RNases at ambient temperature for field/lab collection. | RNAlater, DNA/RNA Shield, PAXgene. |
| Denaturing Lysis Buffers | Contain chaotropic salts (guanidinium) and/or detergents to immediately inactivate RNases during cell disruption. | TRIzol, QIAzol, Buffer RLT. |
| DNase I, RNase-free | Enzyme that digests genomic DNA contamination without degrading RNA. Essential for accurate RNA-Seq. | On-column DNase, Turbo DNase. |
| Magnetic Beads (SPRI) | Size-selective binding of nucleic acids for cleanup and library size selection. Used in most automated NGS workflows. | AMPure XP, SPRIselect. |
| Fragmentation Enzymes | For controlled fragmentation of high-quality RNA, replacing older, less consistent cation-based methods. | NEBNext Magnesium RNA Fragmentation Module. |
| Dual Index UMI Adapters | Unique Molecular Identifiers (UMIs) enable computational correction of PCR duplicates, crucial for quantitative accuracy. | IDT for Illumina UMI kits, NEBNext Unique Dual Index primers. |
Impact of Prep Quality on Central Dogma Interpretation
Meticulous sample preparation is the non-negotiable foundation for reliable RNA-Seq data. By rigorously controlling pre-analytical variables, selecting appropriate isolation and library construction protocols based on objective quality metrics like RIN, and utilizing modern stabilizing reagents, researchers can faithfully capture the transcriptome. This ensures that the interpreted flow of information from DNA through RNA to protein reflects biological reality, enabling robust discoveries in gene regulation, biomarker identification, and drug development.
Addressing Discrepancies Between mRNA Abundance and Protein Output
The central dogma of molecular biology posits a directional flow of information from DNA to RNA to protein. A foundational assumption in transcriptomic studies has been that messenger RNA (mRNA) abundance serves as a reliable proxy for protein output. However, extensive research within the broader thesis of information flow from genome to proteome reveals significant and often unpredictable discrepancies between transcript levels and the corresponding proteome. This discrepancy challenges the predictive power of transcriptomics alone for understanding cellular phenotype, drug target engagement, and metabolic state. This whitepaper provides an in-depth technical analysis of the regulatory mechanisms underlying this discordance and details contemporary experimental strategies to measure and interpret it.
Core Regulatory Mechanisms Causing Discrepancy
The translation of mRNA into protein is a complex, multi-stage process subject to extensive regulation. The following mechanisms are primary contributors to the mRNA-protein divergence.
Transcriptional & Co-Transcriptional Regulation
- Alternative Splicing: Generates multiple mRNA isoforms from a single gene, which can be translated into functionally distinct proteins or degraded via Nonsense-Mediated Decay (NMD).
- RNA Editing (e.g., A-to-I): Alters the nucleotide sequence of the mRNA, potentially changing the amino acid sequence, splicing, or stability of the transcript.
Post-Transcriptional Regulation of mRNA
- mRNA Stability and Decay: mRNA half-lives vary from minutes to hours and are controlled by cis-elements (e.g., AU-rich elements in 3'UTRs) and trans-acting factors (RNA-binding proteins, miRNAs).
- Subcellular Localization: Directed transport and localization of mRNAs to specific subcellular compartments (e.g., axons, stress granules) spatially restricts their translation.
Translational Control
- Initiation Efficiency: This is the most critical rate-limiting step. Regulation occurs via:
- 5' Cap Recognition: Inhibited by 4E-BPs binding to eIF4E.
- Initiation Factor Phosphorylation: (e.g., eIF2α phosphorylation under stress globally dampens translation).
- 5'UTR and 3'UTR Features: Secondary structure, upstream ORFs (uORFs), and binding sites for regulatory proteins/RNAs.
- Elongation Dynamics & Ribosome Pausing: tRNA availability, codon optimality, and regulatory nascent peptide sequences can slow ribosomes, affecting co-translational folding and protein yield.
- Ribosome Profiling: This technique, which maps ribosome-protected mRNA fragments, directly measures translational engagement, revealing actively translated sequences.
Post-Translational Regulation
- Protein Stability and Turnover: Protein half-lives are governed by degradation signals (degrons), post-translational modifications (e.g., ubiquitination for proteasomal degradation), and the cellular environment.
- Co-translational Degradation: Some proteins are ubiquitinated and degraded while still being synthesized, a process known as "ribosome-associated quality control" (RQC).
Table 1: Quantitative Impact of Regulatory Layers on Protein Output
| Regulatory Layer | Key Mechanism | Typical Impact on Protein Yield | Example Experimental Readout |
|---|---|---|---|
| Transcriptional | Alternative Polyadenylation | Can alter protein isoform by ~2-10 fold | 3'-Seq, Long-read RNA-seq |
| mRNA Stability | miRNA-mediated decay | Can reduce protein output by 20-80% | mRNA half-life (SLAM-seq) vs. Pulse-SILAC |
| Translational | eIF2α Phosphorylation | Global reduction of initiation by >70% | Phospho-Western Blot, Ribosome Profiling |
| Translational | uORF in 5'UTR | Can reduce main ORF translation by 3-100 fold | Dual-luciferase reporter, Ribo-seq |
| Protein Stability | N-end Rule Degradation | Protein half-life can vary from minutes to days | Cycloheximide chase, GPS proteomics |
Key Experimental Methodologies
A multi-omics approach is essential to dissect the contributions of each regulatory layer.
Parallel Multi-Omics Measurement
Protocol: Integrated Transcriptomics, Proteomics, and Translational Profiling
- Sample Preparation: Harvest triplicate samples of cells/tissue under identical conditions. Divide each replicate for parallel analysis.
- RNA Sequencing (Transcriptomics):
- Isolate total RNA using a column-based kit with DNase I treatment.
- Prepare libraries using a poly-A selection or ribodepletion protocol.
- Sequence on a platform (e.g., Illumina NovaSeq) to a depth of 30-50 million reads per sample.
- Quantify gene-level expression (TPM, FPKM).
- Ribosome Profiling (Translatomics):
- Treat cells with cycloheximide to arrest ribosomes.
- Lyse cells and digest with RNase I to generate ribosome-protected fragments (RPFs, ~28-30 nt).
- Purify RPFs, dephosphorylate, and ligate to adapters.
- Perform size selection via gel electrophoresis. Construct a library parallel to the RNA-seq library.
- Sequencing depth should exceed that of RNA-seq for robust codon-resolution analysis.
- Mass Spectrometry-Based Proteomics:
- Lyse cells in strong denaturant (e.g., 8M urea).
- Reduce, alkylate, and digest proteins with trypsin.
- Label peptides using TMT or use label-free quantification.
- Analyze via LC-MS/MS on a high-resolution instrument (e.g., Orbitrap Eclipse).
- Use MaxQuant or similar for identification/quantification.
- Data Integration:
- Align RNA-seq and Ribo-seq reads to the reference genome/transcriptome.
- Calculate translational efficiency (TE) as the ratio of RPF density (from Ribo-seq) to mRNA abundance (from RNA-seq).
- Correlate mRNA abundance, TE, and protein abundance to identify genes with high discordance.
Direct Measurement of Protein Turnover
Protocol: Dynamic SILAC (Stable Isotope Labeling by Amino Acids in Cell Culture)
- Labeling: Grow cells in "heavy" media containing stable isotope-labeled essential amino acids (e.g., 13C6-Lysine, 13C6 15N4-Arginine).
- Chase: At time T=0, replace heavy media with standard "light" media.
- Time-Course Sampling: Harvest cells at multiple time points post-chase (e.g., 0, 1, 2, 4, 8, 12, 24 hours).
- Mass Spectrometry Analysis: Process samples as in 3.1.4. The relative heavy/light peptide ratio at each time point indicates the fraction of pre-existing ("old") protein.
- Modeling: Fit the decay curve of the heavy label for each protein to an exponential decay model to calculate individual protein half-lives.
Visualizing Key Pathways and Workflows
The Scientist's Toolkit: Key Research Reagent Solutions
Table 2: Essential Reagents and Tools for Discrepancy Research
| Item Name/Category | Function/Biological Role | Example Application in This Field |
|---|---|---|
| Cycloheximide (CHX) | Translation inhibitor that arrests elongating ribosomes on mRNA. | Essential for freezing translational state in Ribosome Profiling (Ribo-seq) experiments to capture ribosome footprints. |
| Harringtonine/Lactimidomycin | Translation initiation inhibitors that trap ribosomes at start codons. | Used in "initiation complex" profiling to precisely map translation start sites (TSS) and study initiation efficiency. |
| TMTpro 16/18plex Isobaric Tags | Chemical tags for multiplexed quantitative proteomics. | Allows simultaneous quantification of protein abundance from up to 18 different conditions/time points in a single MS run, improving throughput and precision. |
| SILAC Media (Heavy Lysine/Arginine) | Media containing stable isotope-labeled amino acids for metabolic labeling. | Enables dynamic measurement of protein synthesis and degradation rates (via pulse-chase experiments) to separate synthesis from stability effects. |
| 4E-BP1 (Phospho-specific) Antibodies | Detect phosphorylation state of the eIF4E-binding protein, a key regulator of cap-dependent translation initiation. | Used in Western blotting to assess the activity of the mTORC1 pathway and its impact on global translation rates. |
| Puromycin | Aminoacyl-tRNA analog that incorporates into nascent chains, causing chain termination. | Used in Puro-PLA or SUnSET assays to label and visualize/quantify newly synthesized proteins globally. |
| RNase I | Ribonuclease that cleaves single-stranded RNA regions. | Used in Ribo-seq to digest mRNA not protected by the ribosome, generating ribosome-protected fragments (RPFs) for sequencing. |
| CRISPR/dCas9-KRAB or dCas13 | Catalytically dead Cas9/Cas13 fused to transcriptional/RNA silencing effector domains. | Enables targeted perturbation of specific mRNA levels (via CRISPRi) without altering the DNA sequence, to study direct transcriptional vs. translational effects on protein output. |
| Proteasome Inhibitors (MG-132, Bortezomib) | Inhibit the 26S proteasome, blocking ubiquitin-mediated protein degradation. | Used in protein turnover studies (e.g., combined with SILAC) to measure the contribution of proteasomal decay to protein steady-state levels. |
| Codon-Optimized vs. Wild-Type Reporter Plasmids | Reporters with identical protein products but differing mRNA sequences (codon usage). | Directly test the impact of codon optimality on translation elongation efficiency and mRNA stability in controlled experiments. |
Quality Control Metrics for Genomics and Proteomics Datasets
In the central dogma of molecular biology, the flow of information from DNA to RNA to protein is not a perfect conduit. Each step—transcription and translation—introduces potential noise and bias. High-quality datasets in genomics and proteomics are therefore the foundational bedrock for accurate research into this flow, enabling discoveries in basic biology and drug development. This guide details the essential quality control (QC) metrics and protocols for ensuring data integrity at each stage.
Genomics QC Metrics (DNA & RNA Sequencing)
QC for genomics ensures that the sequenced nucleic acids faithfully represent the biological sample, providing a correct template for studying downstream RNA and protein expression.
Key Metrics & Thresholds
The following table summarizes critical QC metrics for Next-Generation Sequencing (NGS) data.
Table 1: Essential QC Metrics for NGS Data (Genomics & Transcriptomics)
| Step | Metric | Ideal Value/Range | Purpose & Interpretation |
|---|---|---|---|
| Raw Data | Q-score (Q30) | ≥ 80% of bases ≥ Q30 | Measures base-calling accuracy. Q30 = 99.9% accuracy. |
| Total Read Count | Project-dependent (e.g., 30-50M for RNA-seq) | Ensures sufficient statistical power for detection. | |
| GC Content | ~40-60%, matching species norm | Deviations indicate contamination or amplification bias. | |
| Alignment | Alignment Rate | > 70-90% (species/genome dependent) | Proportion of reads mapping to the reference genome. Low rates suggest poor sample quality or contamination. |
| Duplication Rate | Variable; < 20-50% often acceptable | High rates in RNA-seq indicate low library complexity; in genomics, may indicate PCR over-amplification. | |
| Post-Alignment (DNA-seq) | Insert Size | Matches library prep expectation | Deviation indicates fragmentation issues. |
| Coverage Uniformity | > 80% of target bases at 0.2x mean coverage | Ensures even sequencing across the genome. | |
| Post-Alignment (RNA-seq) | Strand Specificity | > 90% for stranded protocols | Confirms the success of the stranded library preparation. |
| 5'->3' Bias | Minimal deviation from 1 | Checks for degradation or biased reverse transcription. | |
| Exonic Mapping Rate | > 60-70% | Low rates indicate high ribosomal RNA or genomic DNA contamination. |
Experimental Protocol: RNA-seq Library QC Workflow
A detailed protocol for assessing RNA quality prior to sequencing is critical.
- Sample Integrity Check: Quantify total RNA using a fluorometric assay (e.g., Qubit RNA HS Assay). Assess integrity via capillary electrophoresis (e.g., Agilent Bioanalyzer). An RNA Integrity Number (RIN) ≥ 8.0 is typically required for most applications.
- Library Preparation: Perform poly-A selection or rRNA depletion, followed by cDNA synthesis, adapter ligation, and PCR amplification. Use dual-indexed adapters to prevent sample cross-talk.
- Library QC: Quantify the final library using a dsDNA fluorometric assay (e.g., Qubit dsDNA HS Assay). Assess library size distribution via Bioanalyzer or Fragment Analyzer to confirm the absence of adapter dimers.
- Sequencing: Pool libraries at equimolar concentrations. Sequence on an Illumina, MGI, or PacBio platform according to project needs.
- Bioinformatic QC: Process raw FASTQ files with tools like FastQC for initial metrics. Trim adapters and low-quality bases with Trimmomatic or Cutadapt. Align to a reference genome/transcriptome using STAR (RNA-seq) or HISAT2. Generate alignment statistics with SAMtools and Qualimap. Assess duplication rates and complexity with Picard Tools.
Proteomics QC Metrics
Proteomics QC validates that mass spectrometry data accurately identifies and quantifies proteins, the functional endpoints of the DNA-RNA-protein axis.
Key Metrics & Thresholds
Table 2: Essential QC Metrics for Mass Spectrometry-Based Proteomics
| Step | Metric | Ideal Value/Range | Purpose & Interpretation |
|---|---|---|---|
| Chromatography | Retention Time Stability | RT shift < 2% across runs | Indicates stable liquid chromatography performance. Critical for label-free quantification. |
| Peak Width | Consistent (e.g., 15-30 sec FWHM) | Broad peaks suggest column issues; narrow peaks improve sensitivity. | |
| Base Peak Intensity | Stable across runs | Significant drops indicate instrument sensitivity loss or clogging. | |
| MS1 (Survey Scan) | Total MS1 Spectra Count | Consistent across runs | Reflects overall data acquisition rate. |
| Precursor Mass Accuracy | < 5 ppm (for high-res MS) | Critical for correct peptide identification. | |
| Charge State Distribution | 2+ & 3+ ions dominant | Typical for tryptic peptides. Shift may indicate chemical interference. | |
| MS2 (Fragmentation) | MS2 Spectra Count | Consistent; high as possible | Directly related to depth of proteome coverage. |
| Identification Rate | 20-40% of MS2 spectra yield IDs | Measures efficiency of fragmentation and database searching. | |
| Peptide Sequence Length | 7-20 amino acids | Typical for tryptic peptides. | |
| Post-Search | Protein/Peptide FDR | Typically ≤ 1% | False Discovery Rate threshold for confident identifications. |
| Missing Values | Minimized in LFQ | High rates compromise comparative analysis. | |
| Coefficient of Variation (CV) | < 20% for technical replicates | Assesses quantitative reproducibility. |
Experimental Protocol: Bottom-Up Proteomics QC Workflow
- Sample Preparation: Lyse cells/tissues. Reduce, alkylate, and digest proteins with trypsin/Lys-C. Desalt peptides using C18 solid-phase extraction tips or columns.
- Quality Control Sample: Inject a standardized "QC Reference" sample (e.g., HeLa digest or synthetic peptide mix) at the start of the run and repeatedly throughout the batch to monitor performance.
- LC-MS/MS Acquisition: Load peptides onto a nano-flow LC system with a C18 column. Perform data-dependent acquisition (DDA) or data-independent acquisition (DIA) on a high-resolution mass spectrometer (e.g., Thermo Orbitrap, timsTOF).
- Data Processing: Convert raw files to open formats (e.g., .mzML). For DDA: search spectra against a protein sequence database using MaxQuant, FragPipe, or SearchGUI/PeptideShaker. For DIA: use spectral library-based tools (Spectronaut, DIA-NN) or library-free approaches. Apply standard FDR thresholds (Peptide and Protein FDR ≤ 1%).
- QC Analysis: Use tools like PTXQC (for MaxQuant output), QuaMeter, or mqcq to generate comprehensive QC reports from the processed data, assessing all metrics in Table 2.
The Scientist's Toolkit: Research Reagent Solutions
Table 3: Essential Reagents & Kits for Genomics/Proteomics QC
| Item | Function | Example Product/Brand |
|---|---|---|
| Fluorometric DNA/RNA Assay | Accurate nucleic acid quantification without interference from contaminants. | Qubit dsDNA HS/RNA HS Assay (Thermo Fisher) |
| Capitary Electrophoresis System | Assesses RNA integrity (RIN) or DNA/RNA library fragment size distribution. | Agilent Bioanalyzer / Fragment Analyzer |
| Dual-Indexed Adapter Kits | Allows multiplexed sequencing of many samples while minimizing index hopping. | Illumina TruSeq, IDT for Illumina kits |
| High-Fidelity PCR Mix | Amplifies cDNA or sequencing libraries with minimal error rate. | KAPA HiFi HotStart ReadyMix, NEBNext Ultra II Q5 |
| Mass Spec Grade Trypsin/Lys-C | Specific, high-purity enzymes for reproducible protein digestion. | Trypsin Platinum, Promega / Lys-C, FUJIFILM Wako |
| SPE C18 Desalting Tips | Remove salts and detergents from peptide samples prior to LC-MS. | OMIX, ZipTip (Agilent) |
| QC Reference Peptide Mix | Standardized sample for monitoring LC-MS/MS system performance over time. | HeLa Protein Digest Standard (Pierce), iRT Kit (Biognosys) |
| Phosphatase/Protease Inhibitors | Preserve protein phosphorylation states and prevent degradation during extraction. | PhosSTOP, cOmplete (Roche) |
Integrating these rigorous QC metrics and protocols at each step of the genomics and proteomics pipeline ensures the generation of robust, reproducible data. This, in turn, creates a reliable basis for studying the dynamic flow of biological information, from genetic code to functional proteome, accelerating biomarker discovery and therapeutic development.
Corroborating Evidence: Integrating Multi-Omic Data for Robust Biological Insights
The flow of biological information from DNA to RNA to protein is a core tenet of molecular biology. However, each step—transcription, translation, and post-translational modification—introduces regulatory complexity and potential discordance. mRNA abundance does not always predict protein levels, and protein presence does not equate to functional activity. Orthogonal validation, the use of multiple, independent methodological approaches to confirm a result, is therefore critical for robust biological conclusions. This guide details the strategic integration of three cornerstone techniques—Western Blot (WB), Mass Spectrometry (MS), and Functional Assays—to validate findings within the protein-centric phase of the central dogma, ensuring data reliability for research and drug development.
The Orthogonal Triad: Principles and Complementary Data
Each technique probes a different facet of protein biology. Their combined use provides a comprehensive view.
Western Blot (WB): Provides targeted, semi-quantitative analysis of specific proteins, including information on molecular weight and isoform expression. It confirms the presence and relative abundance of a known protein.
Mass Spectrometry (MS): Offers an untargeted, global profiling approach for protein identification, quantification (relative or absolute), and characterization of post-translational modifications (PTMs). It answers "what proteins are present and in what quantity?" and "how are they modified?"
Functional Assays: Measure the biological activity of a protein or pathway (e.g., enzyme kinetics, cell proliferation, reporter gene activity). They confirm that the protein is not only present but also functionally active.
Table 1: Core Characteristics of the Orthogonal Validation Triad
| Technique | Primary Output | Quantification | Throughput | Key Strengths | Key Limitations |
|---|---|---|---|---|---|
| Western Blot | Detection of specific target protein(s) | Semi-quantitative | Low to medium | High specificity, accessible, size information | Antibody-dependent, limited multiplexing |
| Mass Spectrometry | Identification/quantification of many proteins | Quantitative (Label-free, SILAC, TMT) | Medium to high | Unbiased, PTM analysis, multiplexing | Complex data analysis, high cost, low-abundance detection challenges |
| Functional Assay | Measurement of biological activity | Quantitative (IC50, EC50, activity units) | Variable (low to high) | Direct relevance to phenotype, mechanistic insight | May be indirect, subject to cellular context |
Detailed Experimental Protocols
Western Blot for Targeted Validation
- Sample Preparation: Lyse cells/tissue in RIPA buffer with protease/phosphatase inhibitors. Determine protein concentration via BCA assay.
- Gel Electrophoresis: Load 20-40 µg of protein per lane on a 4-20% gradient SDS-PAGE gel. Run at constant voltage (120-150V) until dye front migrates off gel.
- Transfer: Use wet or semi-dry transfer to a PVDF membrane (0.45 µm) at constant current (200-300 mA) for 60-90 minutes.
- Blocking & Incubation: Block membrane in 5% non-fat milk in TBST for 1 hour. Incubate with primary antibody (dilution per manufacturer) in blocking buffer overnight at 4°C. Wash (3x10 min TBST). Incubate with HRP-conjugated secondary antibody (1:5000) for 1 hour at RT. Wash.
- Detection: Use enhanced chemiluminescence (ECL) substrate and image with a chemiluminescent imager. Normalize target band intensity to a housekeeping protein (e.g., GAPDH, β-actin).
Mass Spectrometry for Global Profiling (Bottom-Up Proteomics)
- Protein Digestion: Denature and reduce lysate (8M Urea, 5mM DTT), alkylate (15mM IAA), and digest with trypsin (1:50 enzyme:protein) overnight at 37°C. Desalt peptides using C18 StageTips.
- LC-MS/MS Analysis: Reconstitute peptides in 0.1% formic acid. Separate via reversed-phase nanoLC (C18 column, 75µm x 25cm) with a 60-180 minute gradient. Analyze eluting peptides on a tandem mass spectrometer (e.g., Q-Exactive, Orbitrap Fusion) operated in data-dependent acquisition (DDA) mode: full MS scan (300-1500 m/z) followed by MS/MS of the top N most intense ions.
- Data Processing: Search raw files against a protein sequence database (e.g., UniProt) using software (MaxQuant, Proteome Discoverer). Filter for false discovery rate (FDR) < 1%. For quantification, use extracted ion chromatograms (label-free) or reporter ion intensities (TMT/SILAC).
Functional Assay Example: Kinase Activity Assay
- Reconstitution: Prepare a reaction buffer (e.g., 25 mM Tris pH 7.5, 5 mM β-glycerophosphate, 2 mM DTT, 0.1 mM Na3VO4, 10 mM MgCl2).
- Reaction Setup: In a 96-well plate, combine purified kinase (10-100 ng), specific substrate peptide/protein (e.g., 200 µM), and ATP (including [γ-³²P]ATP for radiometric or unlabeled ATP for luminescent assays). Include positive (active kinase) and negative (no kinase) controls.
- Incubation & Detection: Incubate at 30°C for 30 minutes. Stop reaction with acid or detection reagent.
- Radiometric: Spot reaction mix on phosphocellulose paper, wash, and quantify by scintillation counting.
- Luminescent: Use ADP-Glo kinase assay; measure luminescence, which is inversely proportional to kinase activity.
Strategic Integration & Data Interpretation Workflow
Diagram Title: Orthogonal Validation Workflow from Hypothesis to Conclusion
The Scientist's Toolkit: Essential Research Reagents & Materials
Table 2: Key Reagent Solutions for Orthogonal Validation
| Item | Primary Function | Application Notes |
|---|---|---|
| RIPA Lysis Buffer | Comprehensive cell/tissue lysis for protein extraction. | Contains detergents (Triton, SDS) and salts; must be supplemented with fresh protease inhibitors. |
| Protease/Phosphatase Inhibitor Cocktails | Preserve protein integrity and phosphorylation states during lysis. | Critical for PTM analysis; use broad-spectrum, EDTA-free cocktails for MS compatibility. |
| BCA Protein Assay Kit | Colorimetric quantification of protein concentration. | Essential for equal loading in WB and for normalizing input for MS and functional assays. |
| Precast SDS-PAGE Gels | Separation of proteins by molecular weight. | Ensure consistency and save time; gradient gels (4-20%) resolve broad size ranges. |
| Validated Primary Antibodies | High-specificity detection of target protein in WB. | Validate using knockout cell lines. Key source of variability. |
| Trypsin, MS-Grade | Specific proteolytic digestion of proteins into peptides for MS. | Essential for bottom-up proteomics; sequencing-grade ensures reproducibility. |
| TMT or SILAC Kits | Multiplexed quantitative proteomics via MS. | TMT: isobaric tags for multiplexing up to 18 samples. SILAC: metabolic labeling for in-vivo quantification. |
| ADP-Glo Kinase Assay Kit | Luminescent measurement of kinase activity. | A universal, non-radioactive functional assay; measures ADP formation. |
| Reporter Gene Assay Systems (Luciferase) | Measure transcriptional activity downstream of a signaling pathway. | Common functional readout for pathways altering gene expression (e.g., NF-κB, STAT). |
| C18 Desalting Columns/StageTips | Desalt and concentrate peptide samples prior to MS. | Remove salts and detergents that interfere with LC-MS analysis. |
Diagram Title: Central Dogma with Orthogonal Validation Techniques Mapped
Case Study: Validating a Putative Kinase in a Signaling Pathway
Context: MS phosphoproteomics of growth factor-stimulated cells identifies "Kinase A" phosphorylation on activation loop residue T185.
- Step 1 - MS Discovery: TMT-based phosphoproteomics shows a 5.2-fold increase in Kinase A pT185 upon stimulation.
- Step 2 - WB Verification: Phospho-specific antibody for Kinase A pT185 confirms increased signal upon stimulation. Total Kinase A levels remain constant (see Table 3).
- Step 3 - Functional Link: siRNA knockdown of Kinase A reduces downstream phosphorylation of known substrate "Protein B" by 70% and decreases cell proliferation by 60% in a functional assay.
Table 3: Integrated Data from Kinase A Validation Case Study
| Assay Type | Metric Measured | Control Condition | Stimulated Condition | Conclusion |
|---|---|---|---|---|
| MS (Phosphoproteomics) | Kinase A pT185 Peptide Abundance | 1.0 (Normalized) | 5.2 ± 0.8 | Stimulation increases T185 phosphorylation. |
| Western Blot | Band Intensity (pKinase A / Total) | 0.1 ± 0.05 | 0.9 ± 0.1 | Independently confirms MS phospho-site finding. |
| Functional (Kinase Assay) | In vitro kinase activity (pmol/min/µg) | 15 ± 3 | 85 ± 10 | Phosphorylation correlates with enhanced enzymatic function. |
| Functional (Proliferation) | Cell Count (Relative to control) | 100% | 40% ± 5% | Kinase A activity is necessary for proliferation. |
Orthogonal validation is not merely a best practice but a necessity for building rigorous, reproducible models of biological function within the DNA-RNA-protein paradigm. By strategically combining the targeted verification of Western Blot, the unbiased discovery power of Mass Spectrometry, and the phenotypic relevance of Functional Assays, researchers can confidently bridge the gap between correlative observation and causative mechanism. This integrated approach de-risks experimental conclusions and is fundamental to advancing both basic research and the development of robust therapeutic targets.
Within the central dogma of molecular biology—the flow of information from DNA to RNA to protein—accurate measurement of RNA transcripts is foundational. Gene expression platforms enable the quantification of this transcriptional output, informing our understanding of cellular states, disease mechanisms, and therapeutic interventions. Benchmarking these platforms for sensitivity (ability to detect low-abundance transcripts), specificity (ability to distinguish between similar sequences), and reproducibility (consistency across runs and sites) is therefore a critical technical exercise for research and drug development. This guide provides an in-depth technical framework for such evaluations.
Core Performance Metrics: Definitions and Quantitative Benchmarks
Sensitivity is typically measured as the limit of detection (LoD) and the dynamic range. Specificity is assessed via metrics like false discovery rate (FDR) in differential expression and cross-mapping rates. Reproducibility is quantified through intra- and inter-platform correlation coefficients (e.g., Pearson's r) and coefficients of variation (CV).
Table 1: Representative Performance Metrics for Major Platform Types (Based on Recent Consortium Studies)
| Platform | Typical LoD (Transcripts/Cell) | Dynamic Range | Specificity (Ambient RNA Correction) | Inter-Replicate Pearson r | Best Application Context |
|---|---|---|---|---|---|
| Bulk RNA-Seq (Illumina) | 0.1-1 | >10⁵ | High (with rRNA depletion) | >0.99 | Profiling homogeneous samples, isoform detection |
| Microarray (Affymetrix) | ~1 | 10³-10⁴ | Moderate | >0.98 | Targeted, cost-effective screening |
| Single-Cell 3' RNA-Seq (10x) | 0.5-2 | ~10³ | Moderate-Low (Subject to dropout) | >0.9 (cell-cell) | Cellular heterogeneity, atlas building |
| Single-Cell Full-Length (Smart-seq2) | 0.01-0.1 | ~10⁴ | High | >0.95 (cell-cell) | Low-input, splice variant analysis |
| Spatial Transcriptomics (Visium) | 1-5 | ~10³ | Low-Moderate | >0.85 (spot-spot) | Tissue architecture, tumor microenvironment |
| Nanopore Direct RNA-Seq | ~10 | ~10⁴ | Moderate (Higher error rate) | >0.9 | Direct RNA modification, real-time sequencing |
Table 2: Key Statistical Measures for Reproducibility Assessment
| Measure | Formula / Description | Acceptance Threshold (Guideline) |
|---|---|---|
| Coefficient of Variation (CV) | (Standard Deviation / Mean) * 100% | <15% for technical replicates |
| Intraclass Correlation Coefficient (ICC) | Measures consistency across replicates/groups. ICC > 0.9 indicates excellent reliability. | >0.75 for biological interpretation |
| Pearson's Correlation Coefficient (r) | Measures linear dependence between two expression profiles. | >0.95 for technical replicates; >0.8 for biological replicates |
| Spearman's Rank Correlation (ρ) | Measures monotonic relationship, less sensitive to outliers. | >0.9 for technical replicates |
Experimental Protocol for Cross-Platform Benchmarking
Objective: To systematically compare the sensitivity, specificity, and reproducibility of two or more gene expression platforms using a common biological reference sample.
3.1. Reference Sample Design:
- Cell Line: Use a well-characterized, genomically stable cell line (e.g., HEK293T, K562).
- Spike-in Controls: Employ a calibrated mixture of exogenous RNA controls (e.g., ERCC RNA Spike-In Mix or SIRV Set) at known, varying abundances spanning a wide concentration range (e.g., 6 logs). This allows absolute sensitivity and dynamic range calibration.
- Background Complexity: Prepare samples with varying input amounts (e.g., 1 ng, 10 ng, 100 ng total RNA) and RNA integrity numbers (RIN) to assess platform robustness.
3.2. Experimental Replication:
- Technical Replicates: Minimum of n=5 per condition/platform from the same RNA extraction.
- Process Replicates: n=3 independent library preparations from the same RNA stock.
- Operator/Batch Replicates: Perform experiments across different days and by different technicians if assessing reproducibility for core facility deployment.
3.3. Core Workflow:
- Total RNA Isolation: Using a silica-membrane column kit with DNase I treatment. Precisely quantify using fluorometry (e.g., Qubit).
- Quality Control: Assess integrity via Bioanalyzer or TapeStation (RIN > 9.0 required for benchmark).
- Spike-in Addition: Add a known attomole/μL amount of spike-in mix to a fixed amount of sample total RNA.
- Parallel Library Preparation: For each platform (e.g., Illumina Poly-A selection, 10x 3’ v3.1 kit, Nanostring nCounter), follow manufacturer protocols simultaneously from the same RNA+spike-in aliquot.
- Sequencing/Detection: Run platforms according to standard procedures. For NGS, target a minimum depth (e.g., 30M paired-end reads for bulk RNA-Seq).
- Data Processing: Use a modular, containerized pipeline (e.g., Nextflow/Snakemake) with platform-specific, then common, analysis steps.
- Platform-Specific: Read alignment (STAR, Cell Ranger) and quantification (featureCounts, RSEM).
- Common Analysis: Merge endogenous and spike-in counts. Filter low-abundance genes. Normalize using spike-in aware methods (e.g., DESeq2 with spike-in size factors, or SCRAN for scRNA-seq).
3.4. Key Analysis for Benchmarking:
- Sensitivity: Plot spike-in input concentration vs. measured counts. Calculate LoD (lowest concentration with CV < 0.3 and detection p < 0.05) and linear dynamic range. Plot detection probability vs. expression level for endogenous genes.
- Specificity: Calculate the cross-mapping rate for reads aligning to paralogous gene families. For differential expression (mock case vs. control), plot the observed vs. expected FDR using spike-ins as known negatives/positives.
- Reproducibility: For all replicate types, calculate Pearson r, Spearman ρ, and CV across expression values. Generate correlation matrices and PCA plots.
Diagram 1: Cross-platform benchmarking workflow.
Key Signaling Pathways in the DNA-RNA-Protein Flow Context
Gene expression platforms measure the RNA layer, which is dynamically regulated by signaling pathways. Accurate benchmarking must consider how platform choice impacts the detection of transcripts from these pathways.
Diagram 2: Signaling to transcription measurement.
The Scientist's Toolkit: Research Reagent Solutions
Table 3: Essential Materials for Benchmarking Experiments
| Item Category | Specific Example | Function in Benchmarking |
|---|---|---|
| Reference RNA | ERCC RNA Spike-In Mix (Thermo Fisher) | Precisely defined exogenous RNAs used as internal controls to calculate absolute sensitivity, dynamic range, and detection limits across platforms. |
| Quality Control Kits | Agilent RNA 6000 Nano Kit | Assess RNA Integrity Number (RIN) to ensure sample quality is consistent and high prior to library prep, removing a key variable. |
| Universal Human Reference RNA | UHRR (Agilent) or HBRR (Thermo Fisher) | Complex, standardized biological RNA from multiple cell lines providing a consistent background for cross-laboratory reproducibility studies. |
| RNA Quantitation Kits | Qubit RNA HS Assay (Thermo Fisher) | Fluorescence-based quantification specific to RNA, more accurate than A260 for low-concentration samples used in sensitivity tests. |
| Library Prep Kits (NGS) | Illumina Stranded mRNA Prep | Standardized, automated-ready kit for bulk RNA-Seq benchmarking arm. Enables fair comparison of performance metrics. |
| Single-Cell Partitioning System | 10x Genomics Chromium Controller & 3' v3.1 Kit | Provides a standardized, high-throughput method for capturing single cells and generating barcoded libraries for scRNA-seq platform evaluation. |
| Nuclease-Free Water | Molecular Biology Grade (e.g., Ambion) | Used as a negative control (no template) in library preparations to assess kit-specific background noise and contamination. |
| Data Analysis Pipeline | nf-core/rnaseq (Nextflow) | A community-curated, containerized pipeline ensuring reproducible and identical analysis for all NGS data, eliminating bioinformatics variability. |
This technical guide explores the methodologies and challenges of integrating transcriptomic and proteomic data, a critical endeavor within the broader thesis of understanding the flow of biological information from DNA to RNA to protein. While central dogma outlines the fundamental pathway, the correlation between mRNA abundance and protein levels is often weak, typically ranging from 0.4 to 0.6 (Spearman's ρ). This discrepancy underscores the extensive regulation occurring post-transcriptionally, including translational control, protein turnover, and post-translational modifications. For researchers and drug developers, elucidating these mechanisms is essential for identifying robust biomarkers and actionable therapeutic targets.
Core Concepts and Quantitative Discrepancies
The relationship between transcript and protein levels is governed by multiple factors. Key quantitative insights are summarized below.
Table 1: Key Factors Contributing to mRNA-Protein Discordance & Their Estimated Impact
| Factor | Description | Typical Impact/Correlation Range |
|---|---|---|
| Translational Efficiency | Rate of protein synthesis per mRNA molecule. Can vary >100-fold between transcripts. | Major contributor; explains ~50% of variance. |
| Protein Degradation Rates | Half-lives of proteins range from minutes to weeks, independent of mRNA stability. | Major contributor; explains ~40% of variance. |
| Post-Translational Modifications | Alter function, localization, and stability without changing core protein abundance. | Functional impact high; abundance correlation unaffected. |
| Technical Noise | Platform sensitivity, coverage, and batch effects in omics measurements. | Can reduce observed correlation by 0.1-0.2. |
| Overall Correlation | Typical Spearman correlation coefficient in large-scale studies. | ρ = 0.4 - 0.6 |
Table 2: Common Omics Platforms for Correlation Studies
| Platform Type | Specific Technology (Transcriptomics) | Specific Technology (Proteomics) | Throughput | Key Limitation |
|---|---|---|---|---|
| Bulk Analysis | RNA-seq, Microarrays | LC-MS/MS (Label-free, TMT, SILAC), Antibody Arrays | High (1000s of genes/proteins) | Masks cellular heterogeneity. |
| Single-Cell Analysis | scRNA-seq | scProteomics (e.g., SCoPE2, plexDIA) | Medium (10s-100s of cells) | Low protein detection depth. |
| Spatial Analysis | Spatial Transcriptomics | Spatial Proteomics (IMC, CODEX) | Medium | Resolution trade-off. |
Detailed Experimental Protocols
Protocol 1: Paired Sample Preparation for Multi-Omic Integration
Objective: To generate matched transcriptomic and proteomic data from the same biological sample source.
Materials: See "The Scientist's Toolkit" below. Procedure:
- Cell/Tissue Lysis: Homogenize sample in a suitable lysis buffer (e.g., RIPA with protease/RNase inhibitors). Maintain cold chain.
- Sample Aliquotting: Split the homogenate into two equal portions.
- For RNA-seq: Add TRIzol to one aliquot. Proceed with phase separation, RNA precipitation, and wash. Perform DNase I treatment. Assess RNA integrity (RIN > 8 recommended). Prepare library (poly-A selection or ribosomal depletion).
- For Proteomics (LC-MS/MS): To the other aliquot, add urea/SDS lysis buffer. Perform protein reduction (DTT) and alkylation (IAA). Digest proteins with trypsin/Lys-C overnight at 37°C. Desalt peptides using C18 StageTips.
- Data Generation: Process RNA libraries on an Illumina sequencer. Analyze peptides by nanoLC coupled to a high-resolution tandem mass spectrometer (e.g., Q-Exactive, timsTOF).
- Bioinformatics Processing:
- RNA-seq: Align reads (STAR, HISAT2) to reference genome. Quantify gene-level counts (featureCounts). Normalize (e.g., TPM, DESeq2).
- Proteomics: Search MS/MS spectra (MaxQuant, DIA-NN) against a protein sequence database. Quantify based on precursor intensity (LFQ) or reporter ions (TMT). Normalize and impute missing values (if appropriate).
Protocol 2: Ribosome Profiling (Ribo-seq) to Measure Translation
Objective: To experimentally assess translational efficiency by sequencing ribosome-protected mRNA fragments.
Procedure:
- Cell Harvesting: Rapidly arrest translation by adding cycloheximide to culture media. Wash cells on ice.
- Cell Lysis & Nuclease Digestion: Lyse cells and treat lysate with RNase I to digest mRNA not protected by ribosomes.
- Ribosome Fragment Isolation: Purify the ribosome-protected fragments (RPFs, ~28-30 nt) by sucrose cushion centrifugation or size selection on a gel.
- Library Construction: Dephosphorylate RPFs, ligate adapters, reverse transcribe, and circularize for sequencing.
- Data Analysis: Align RPF reads, determine their periodicity (confirms ribosome origin), and quantify reads in coding sequences. Translational Efficiency (TE) is calculated as:
TE = (RPF counts for gene / mRNA counts for gene).
Key Data Integration and Analysis Workflow
The logical flow for correlating datasets and inferring regulatory modes is depicted below.
Title: Multi-Omic Integration Workflow for Post-Transcriptional Analysis
Signaling Pathways Influencing mRNA-Protein Correlation
Post-transcriptional regulation is often mediated by specific pathways. The mTOR signaling pathway is a prime example, influencing both translation and degradation.
Title: mTOR Pathway Impacts Translation and Degradation
The Scientist's Toolkit
Table 3: Essential Research Reagents & Solutions for Multi-Omic Studies
| Item/Category | Function & Rationale |
|---|---|
| TRIzol/RNA Later | Maintains RNA integrity during sample splitting by immediately inhibiting RNases. |
| RIPA Lysis Buffer | Efficiently extracts both proteins and nucleic acids, allowing for sample aliquotting. |
| Protease & Phosphatase Inhibitor Cocktails | Preserves the proteome and phosphoproteome state during lysis. |
| Trypsin/Lys-C | High-specificity protease for generating peptides for LC-MS/MS analysis. |
| Tandem Mass Tag (TMT) Reagents | Enable multiplexed (e.g., 16-plex) quantitative proteomics, reducing batch effects. |
| Cycloheximide | Translation inhibitor used in Ribo-seq to "freeze" ribosomes on mRNA. |
| DNase I (RNase-free) | Removes genomic DNA contamination from RNA-seq preparations. |
| Streptavidin Beads | For pull-down assays to validate protein-RNA or protein-protein interactions. |
| High-pH Reverse-Phase Peptide Kits | Fractionate complex peptide samples to increase proteomic depth. |
| ERCC RNA Spike-In Mix | External RNA controls for normalizing and assessing technical variation in RNA-seq. |
Systematic correlation of transcriptomic and proteomic datasets moves research beyond a simple catalog of parts toward a dynamic understanding of the regulatory landscape governing the flow of biological information. By employing rigorous paired-sample protocols, advanced computational integration, and targeted validation through techniques like ribosome profiling, researchers can pinpoint the specific nodes of post-transcriptional control. This knowledge is indispensable for deconvoluting disease mechanisms and identifying the most relevant molecular targets for therapeutic intervention, where protein function, not mRNA expression, is the ultimate effector.
Target discovery and validation exist within the fundamental flow of biological information: DNA → RNA → Protein → Phenotype. RNA interference (RNAi) screens directly intercept this pathway at the post-transcriptional mRNA level, enabling systematic interrogation of gene function. The subsequent journey from hit identification to clinical candidate requires rigorous validation along each step of this informational cascade, ensuring that modulating a specific RNA leads to a predictable and therapeutically relevant change in protein function and cellular phenotype.
The RNAi Screening Phase: From Genome-Wide to Focused Hits
Experimental Protocol: Genome-Wide RNAi Screen (Cell-Based Viability)
- Objective: Identify genes whose knockdown affects cell viability in a cancer cell line.
- 1. Library & Transfection: Utilize a commercially available genome-wide siRNA library (e.g., Ambion Silencer Select or Dharmacon ON-TARGETplus). Reverse transfect cells in 384-well plates using a lipid-based transfection reagent optimized for high-throughput.
- 2. Controls: Include wells with non-targeting siRNA (negative control), siRNA targeting an essential gene (e.g., PLK1, positive killing control), and transfection reagent only.
- 3. Incubation: Incubate for 96-120 hours to allow for protein turnover post-knockdown.
- 4. Viability Assay: Add a homogeneous cell viability reagent (e.g., CellTiter-Glo) to measure ATP content as a proxy for live cells. Luminescence is read on a plate reader.
- 5. Data Analysis: Normalize plate data using median polish. Calculate Z-scores or strictly standardized mean difference (SSMD) for each siRNA. Hit selection is based on robust statistical thresholds (e.g., Z-score < -2 or > 2) and reproducibility across replicates.
Quantitative Output from a Representative Screen:
Table 1: Summary Statistics from a Genome-Wide Viability Screen
| Metric | Value | Description |
|---|---|---|
| Library Size | ~18,000 genes | Human genome coverage |
| Primary Hits (Z-score < -2) | ~450 genes | Putative essential genes |
| False Discovery Rate (FDR) | < 5% | Adjusted p-value threshold |
| Replicate Concordance (R²) | > 0.85 | Between screen replicates |
| Confirmed Hits (Secondary) | ~150 genes | Validated by deconvoluted siRNAs |
Hierarchical Target Validation: From Genetic to Pharmacological
Protocol: Orthogonal Genetic Validation (CRISPR-Cas9)
- Objective: Confirm phenotype using an independent genetic knockdown method.
- Design: Design 3-5 single-guide RNAs (sgRNAs) per target gene using optimized algorithms (e.g., from Broad Institute). Clone into a lentiviral Cas9/sgRNA expression vector.
- Production: Generate lentivirus for each sgRNA and a non-targeting control.
- Infection: Transduce the same cell line used in the RNAi screen at low MOI to ensure single-copy integration. Select with puromycin.
- Analysis: Assess viability via competition-based growth assays (by tracking genomic DNA abundance) or colony formation. Perform next-gen sequencing on target sites to confirm indel formation and correlate with phenotype.
Protocol: Biochemical & Pathway Validation
- Objective: Verify knockdown efficiency and map target to a disease-relevant pathway.
- Knockdown Verification: Perform qRT-PCR (for mRNA) and western blot (for protein) 72-96 hours post-siRNA transfection. ≥70% knockdown is typically required.
- Pathway Analysis: Using lysates from knockdown cells, perform phospho-specific western blots or multiplex immunoassays (Luminex) to measure activity in key signaling nodes (e.g., p-AKT, p-ERK, cleaved caspase-3).
Lead Compound Development: Bridging to Clinical Candidates
Case Study Data: From RNAi Hit to Clinical Inhibitor
Table 2: Validation Metrics for a Fictional Oncology Target "Kinase X"
| Validation Stage | Assay | Result | Key Metric |
|---|---|---|---|
| RNAi Phenotype | Viability (siRNA) | Reduced proliferation | IC50 (siRNA) = 20nM |
| Orthogonal Genetic | Viability (CRISPR) | Reduced proliferation | Gene Effect Score = -1.2 |
| Biochemical | Western Blot | >80% protein knockdown | p-Target ↓ 90% |
| Pathway Engagement | Phospho-RTK Array | Reduced p-ERK, p-AKT | Pathway suppression confirmed |
| Small Molecule | In vitro kinase assay | Inhibits Kinase X activity | Biochemical IC50 = 5 nM |
| Cellular Potency | Cell viability + inhibitor | Inhibits growth | Cellular IC50 = 50 nM |
| In Vivo Efficacy | Mouse xenograft model | Tumor growth inhibition | 60% TGI at 50 mg/kg |
The Scientist's Toolkit: Essential Research Reagents
Table 3: Key Reagent Solutions for RNAi-Based Target Validation
| Reagent / Material | Function & Rationale |
|---|---|
| ON-TARGETplus siRNA Libraries (Dharmacon) | Minimizes off-target effects via chemical modification and pool design; essential for clean primary data. |
| Lipofectamine RNAiMAX (Thermo Fisher) | High-efficiency, low-cytotoxicity transfection reagent optimized for siRNA delivery in adherent cells. |
| CellTiter-Glo 2.0 (Promega) | Luminescent ATP assay for viability; highly sensitive, homogeneous, and HTS-compatible. |
| lentiCRISPR v2 Vector (Addgene) | All-in-one plasmid for expressing Cas9 and sgRNA; standard for orthogonal knockout validation. |
| Phospho-Specific Antibody Panels (CST) | Validated antibodies to detect changes in pathway activity upon target modulation. |
| Recombinant Target Protein (e.g., Carna Biosciences) | High-purity protein for developing biochemical inhibition assays for compound screening. |
| PDX or Cell-Line Derived Xenograft Models (Champions Oncology, Jackson Labs) | Clinically relevant in vivo models for evaluating efficacy of leads. |
The rigorous validation of therapeutic targets emerging from RNAi screens demands a multi-layered approach that traces the consequence of genetic perturbation through the central dogma. Success requires transitioning from statistical hits in an RNAi screen to demonstrating a direct, mechanistic link between the target protein's activity, its position in a disease-driving pathway, and a favorable phenotypic outcome. This systematic process, integrating orthogonal genetic tools, biochemical assays, and pharmacological agents, de-risks the pipeline and provides the foundational evidence required to advance a true clinical candidate.
In molecular pathology and research, the precise spatial localization of biomolecules within tissues is paramount. This debate centers on two dominant, yet fundamentally different, techniques: in situ hybridization (ISH) for nucleic acid (DNA/RNA) detection and immunohistochemistry (IHC) for protein detection. Their comparative utility is intrinsically tied to the flow of biological information—the central dogma—from genotype to phenotype. While ISH probes the RNA (or DNA) blueprint, IHC visualizes the functional protein endpoint. The choice of "gold standard" is not universal but is dictated by the specific biological question within this continuum.
Core Principles and Technical Foundations
In SituHybridization (ISH)
ISH localizes specific nucleic acid sequences within cells or tissues using complementary labeled probes. It directly interrogates the presence and abundance of RNA transcripts (via RNA-ISH) or viral/genomic DNA, providing a snapshot of gene expression at the transcriptional level.
Key Protocol (RNAscope - A Modern RNA-ISH Approach):
- Tissue Preparation: Fix tissue in 10% Neutral Buffered Formalin (NBF) for 24h, process, embed in paraffin (FFPE), and section at 5 µm.
- Pretreatment: Bake slides, deparaffinize, and perform heat-induced epitope retrieval (HIER) in a proprietary buffer.
- Protease Digestion: Digest with a mild protease to permeabilize tissue without destroying RNA.
- Hybridization: Apply target-specific "Z"-probe pairs (20-25 bp each) designed to hybridize contiguously to the target RNA. Incubate at 40°C for 2 hours.
- Signal Amplification: A series of sequential amplifier molecules bind to the Z-probes, building a polymeric structure that enables significant signal amplification without background.
- Detection: Use chromogenic (DAB, Fast Red) or fluorescent detection. Counterstain and mount.
Immunohistochemistry (IHC)
IHC localizes specific proteins (antigens) in tissues using labeled antibodies. It reveals the final functional products of gene expression, reflecting post-transcriptional and translational regulation, as well as protein stability and localization.
Key Protocol (Standard Indirect IHC for FFPE Tissue):
- Tissue Preparation: Fix in 10% NBF for 24h, process to FFPE blocks, section at 4-5 µm.
- Deparaffinization & Rehydration: Use xylene and graded ethanol series.
- Antigen Retrieval: Perform HIER in citrate (pH 6.0) or EDTA/ Tris (pH 9.0) buffer using a pressure cooker or water bath (95-100°C, 20-30 min) to unmask epitopes.
- Blocking: Incubate with 3% hydrogen peroxide to block endogenous peroxidase, then with a protein block (e.g., serum, BSA) to prevent non-specific antibody binding.
- Primary Antibody Incubation: Apply monoclonal or polyclonal primary antibody specific to the target antigen. Incubate at 4°C overnight or room temperature for 1 hour.
- Secondary Antibody & Detection: Apply a labeled polymer secondary antibody (e.g., HRP-conjugated) for 30-60 min. Visualize with DAB chromogen (brown precipitate).
- Counterstaining & Mounting: Counterstain with hematoxylin, dehydrate, clear, and mount with a permanent medium.
Comparative Analysis: Data and Applications
Table 1: Direct Comparison of ISH and IHC
| Feature | In Situ Hybridization (ISH) | Immunohistochemistry (IHC) |
|---|---|---|
| Target Molecule | DNA, RNA (mRNA, miRNA, lncRNA) | Proteins (antigens) |
| Detection Agent | Labeled nucleic acid probe | Labeled antibody |
| Primary Readout | Gene transcription / viral genome presence | Protein abundance and localization |
| Sensitivity | High (especially with signal amplification, e.g., RNAscope) | High, but dependent on antibody affinity and retrieval |
| Specificity | Very high; determined by probe sequence | Variable; critically dependent on antibody validation |
| Quantification | Semi-quantitative; spot counting possible | Semi-quantitative; H-score, digital pathology |
| Key Advantages | Direct link to genetics; detects non-translated RNA; high specificity | Direct visualization of functional effector; established, high-throughput |
| Key Limitations | Cannot assess protein functionality or PTMs; RNA degradation risk | Cross-reactivity; epitope masking; no info on transcript dynamics |
| Best Application | Viral detection, gene fusion identification, RNA expression localization | Diagnostic pathology, protein activation status, tumor subtyping |
Table 2: Published Performance Metrics (Representative Data)
| Study Context | ISH Sensitivity/Specificity | IHC Sensitivity/Specificity | Concordance | Notes |
|---|---|---|---|---|
| HER2 in Breast Cancer* | 96.5% / 100% (FISH) | 92% / 99% | 97.5% | FISH remains gold standard for HER2 gene amplification. |
| PD-L1 in NSCLC* | N/A | 80-90% (inter-antibody variability) | 70-85% (between assays) | RNA-ISH shows promise as a complementary quantitative tool. |
| EBER in Lymphoma | >99% / >99% (ISH) | 85% / 95% (LMP1 IHC) | ~90% | EBER-ISH is the clinical gold standard for EBV detection. |
| Data synthesized from recent CAP guidelines and peer-reviewed literature (2022-2024). |
Integration with the Central Dogma: A Pathway View
Title: Central Dogma and Spatial Detection Techniques
Experimental Workflow Decision Guide
Title: ISH vs. IHC Experimental Selection Workflow
The Scientist's Toolkit: Essential Reagents and Materials
Table 3: Key Research Reagent Solutions
| Item | Function | Key Considerations for Use |
|---|---|---|
| Formalin-Fixed, Paraffin-Embedded (FFPE) Tissue | The standard archival material for both ISH & IHC; preserves morphology. | Fixation time must be standardized (18-24h) to prevent over-fixation which masks epitopes and degrades RNA. |
| Protease (for ISH) | Enzyme (e.g., Protease III) used to permeabilize tissue for probe access while preserving RNA integrity. | Concentration and time are critical; too harsh destroys tissue architecture. |
| Target Retrieval Buffer (for IHC) | Citrate (pH 6.0) or EDTA/Tris (pH 9.0) buffers used in heat-induced epitope retrieval (HIER). | pH and heating method (pressure cooker, steamer, water bath) must be optimized per antibody. |
| Validated Primary Antibody (for IHC) | Monoclonal or polyclonal antibody specific to the protein target of interest. | The single largest source of variability. Use clinically validated or CRISPR-validated antibodies with appropriate controls. |
| Labeled Nucleic Acid Probes (for ISH) | DNA or RNA oligonucleotides complementary to the target sequence, tagged with haptens (e.g., DNP). | Design for high specificity and minimal self-hybridization. Amplification technologies (e.g., RNAscope) use proprietary probe designs. |
| Signal Amplification System | Enzyme polymers (HRP/AP) or tyramide-based (CISH) systems that amplify the primary detection signal. | Reduces background and increases sensitivity. Crucial for low-abundance targets. |
| Chromogenic Substrate (DAB) | 3,3'-Diaminobenzidine; produces an insoluble brown precipitate upon reaction with HRP enzyme. | Hazardous material. Reaction time must be controlled microscopically to prevent high background. |
| Fluorescent Dyes (for Multiplexing) | Fluorophores (e.g., Cy3, Cy5, Alexa Fluor dyes) attached to probes or antibodies for multiplex detection. | Requires specialized microscopes and careful spectral unmixing to avoid bleed-through. |
The debate between ISH and IHC as a gold standard is resolved not by declaring a universal winner, but by precisely defining the research question within the DNA→RNA→protein pathway. For detecting genetic alterations, viral genomes, or measuring transcriptional activity, ISH is unequivocal. For assessing functional protein output, localization, and post-translational modifications, IHC is indispensable. The future of spatial biology lies in multiplexed and integrated approaches, combining RNA-ISH with protein-IHC on the same tissue section, thereby capturing multiple layers of the central dogma simultaneously and providing a truly holistic view of molecular architecture in health and disease.
Utilizing Public Repositories (e.g., ENCODE, GTEx) for Cross-Study Comparison and Validation
Within the central dogma's framework—the flow of biological information from DNA to RNA to protein—public data repositories have become indispensable for validation and hypothesis generation. This technical guide details methodologies for leveraging ENCODE and GTEx to perform robust cross-study comparisons, ensuring reproducibility and enhancing mechanistic insights in genomics and drug discovery.
Public repositories systematically capture snapshots of information flow. ENCODE provides foundational, often functional, genomic annotations (DNA-level regulation, chromatin state, transcription factor binding). GTEx offers a population-scale perspective on resultant RNA expression (RNA-level variation) across normal human tissues. Cross-referencing these resources allows researchers to connect regulatory potential with realized expression, bridging DNA-to-RNA understanding and informing protein-level studies.
Table 1: Core Repository Specifications for Cross-Study Analysis
| Repository | Primary Focus (Central Dogma Stage) | Key Data Types | Sample/Tissue Scope (as of 2024) | Primary Use in Cross-Validation |
|---|---|---|---|---|
| ENCODE | DNA -> RNA Regulation | ChIP-seq (TFs, histones), ATAC-seq, RNA-seq, RBP assays | ~10,000 experiments across cell lines, tissues (human/mouse) | Define regulatory elements; validate candidate cis-regulatory modules (cCREs). |
| GTEx (v8/v9) | RNA Expression Variation | Bulk RNA-seq, eQTLs, sQTLs | ~17,000 samples from 948 donors across 54 normal tissues. | Validate expression patterns and splicing; contextualize disease-associated genetic variants. |
| dbGaP | Linked Genotype-Phenotype | Genotype, phenotype, association results | Controlled-access for many NIH studies (incl. GTEx). | Facilitate genotype-aware re-analysis of public RNA/DNA data. |
| ProteomicsDB / PRIDE | Protein Expression & Modification | Mass spectrometry proteomics, PTMs | Cell lines, tissues (coverage less comprehensive than genomics). | Tentative validation of RNA-protein correlation (post-transcriptional regulation). |
Table 2: Example Quantitative Data from Integrated ENCODE/GTEx Analysis Hypothetical analysis linking ENCODE H3K27ac marks to GTEx expression in liver tissue.
| Genomic Region (Gene) | ENCODE H3K27ac Signal (Peak Intensity) in HepG2 | GTEx Median TPM (Liver) | Correlation (Pearson's r) | Validated as Liver-Specific Enhancer? |
|---|---|---|---|---|
| ALB (Albumin) | 125.6 | 120.5 | 0.89 | Yes |
| CYP3A4 | 98.7 | 65.2 | 0.76 | Yes |
| GeneX (Housekeeping) | 15.2 | 25.1 | 0.12 | No |
Core Experimental Protocols for Repository Data Re-Use
Protocol 1: Validating Cell-Type Specific Regulatory Elements
- Define Candidate Regions: From your primary study (e.g., ATAC-seq peaks), identify coordinates of putative regulatory elements.
- Query ENCODE: Use the SCREEN portal or API to retrieve histone modification (H3K4me3, H3K27ac) and TF ChIP-seq signal tracks for relevant cell lines/tissues.
- Signal Extraction: Use
bigWigAverageOverBed(UCSC tools) to quantify ENCODE signals over your candidate regions. - Correlate with Expression: Fetch GTEx RNA-seq data (TPM values) for genes associated with your candidate regions (e.g., nearest gene). Use the GTEx Portal or
recount3R package. - Statistical Validation: Perform correlation analysis (e.g., Spearman) between chromatin signal strength and tissue-specific expression levels across matched tissues/cell types.
Protocol 2: Contextualizing Disease-Associated Genetic Variants (eQTL colocalization)
- Variant List: Compile list of disease/trait-associated SNPs from GWAS.
- Identify Candidate Genes: Use ENCODE chromatin interaction data (e.g., Hi-C) from relevant cell types to link SNP-containing regions to target gene promoters.
- Validate Regulatory Potential: Check if the SNP locus overlaps ENCODE TF binding sites or chromatin accessibility peaks.
- Test for eQTL Effects: Query the GTEx eQTL browser or use summary statistics to determine if the SNP genotype correlates with expression of the linked gene in disease-relevant tissues.
- Colocalization Analysis: Perform formal statistical colocalization (e.g., using
colocR package) between GWAS and GTEx eQTL signals to assess shared causal variant probability.
Visualization of Integrated Analysis Workflows
Integrated ENCODE and GTEx Analysis Workflow
Information Flow from DNA Variant to Disease Phenotype
Table 3: Key Reagent Solutions for Cross-Repository Validation Experiments
| Item / Resource | Function in Validation Pipeline | Example / Supplier |
|---|---|---|
| Reference Genome | Essential coordinate system for aligning and comparing data across studies. | GRCh38/hg38 (primary), GRCm38/mm10 (mouse). |
| Genomic Range Tools | Manipulate BED, GTF, bigWig files; intersect features, quantify signals. | bedtools, bigWigAverageOverBed (UCSC). |
| ChIP-seq Grade Antibodies | For orthogonal validation of ENCODE-predicted TF binding or histone marks. | Cell Signaling Technology, Abcam, Active Motif. |
| CRISPR Activation/Inhibition | Functionally validate enhancer-gene links predicted by ENCODE+GTEx. | Synthego, ToolGen sgRNA libraries; dCas9-VPR/dCas9-KRAB systems. |
| RT-qPCR Assays | Validate GTEx expression trends or eQTL effects in new cell/tissue samples. | TaqMan assays (Thermo Fisher), SYBR Green reagents. |
| API Clients & R/Python Packages | Programmatic access to repository data for reproducible analysis. | recount3, GREP, encodeR (R); pyGTEx, requests (Python). |
| Colocalization Software | Statistically assess shared genetic signals between QTLs and traits. | coloc R package, GWAS-PW. |
Conclusion
The journey from DNA to RNA to protein remains the foundational axis of cellular function, yet our understanding has evolved far beyond a simple linear model. Integrating foundational knowledge with advanced methodological tools, rigorous troubleshooting protocols, and robust validation frameworks is essential for meaningful discovery. For biomedical researchers and drug developers, mastering this integrated view is critical. Future directions will focus on leveraging single-cell and spatial technologies to map information flow in disease contexts, harnessing RNA-based therapeutics that directly intervene in this pathway, and developing computational models that predict protein output from genetic and epigenetic landscapes. Successfully bridging these domains will accelerate the development of precise diagnostics and transformative therapies.